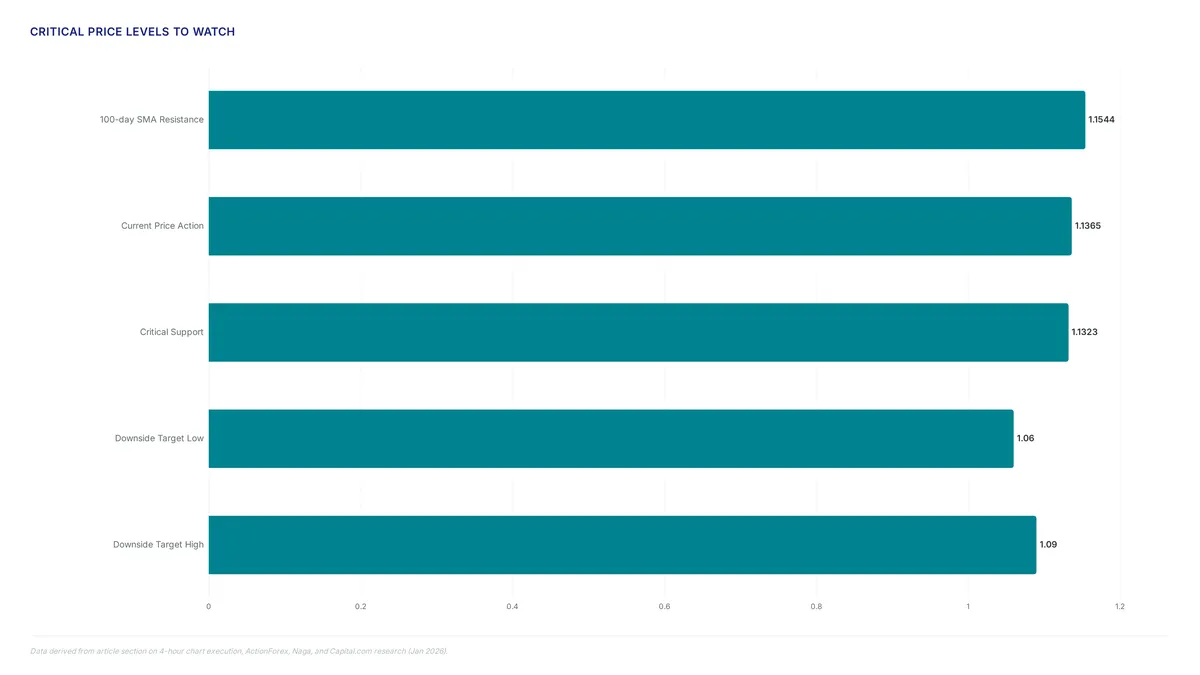
EUR/USD pair drops to 1.1365 as dollar surges
The EUR/USD pair dropped to a one-year low near 1.1365 as the US Dollar Index hit a 13-month high.
Breakdowns below psychological marks like 1.1500 confirm bearish dominance, yet the Relative Strength Index (14) lingers in oversold territory near 21. Repeated rejections at the 100-period Simple Moving Average on the 4-hour chart suggest any recovery will face stiff resistance before sellers potentially face fatigue.
Despite accounting for an estimated significant share of all global transactions, the pair remains vulnerable to current bullish USD momentum. Traders must navigate these technical mechanics and fundamental drivers to identify valid reversal points rather than chasing a falling knife in this volatile environment.
Fundamental Drivers Behind EUR/USD Decline and USD Strength
Fed Rate Hike Expectations and Sticky Inflation Drivers
Sticky inflation forces traders to price in Federal Reserve rate hikes by year-end, a shift that immediately boosts US Dollar yields. Capital flows toward higher returns, pushing the USD Index (DXY) to a 13-month high despite hawkish signals from Europe. This divergence overshadows the European Central Bank, creating a steep cost gap that drains liquidity from Euro-denominated assets.
Weekly performance illustrates the scale of this rotation: the Greenback gained 2.16% against the Euro while surging 3.16% versus the New Zealand Dollar. Higher yields create a self-reinforcing cycle where capital flight from the Eurozone accelerates the pair's decline. Positions on EUR/USD carry significant risk given the sharp divergence in central bank expectations.
DXY Index Impact on EUR/USD Pair Pressure
Broad index strength often crushes local fundamental nuances. The USD Index (DXY) has risen to a 13-month high, exerting significant downward pressure on the EUR/USD pair regardless of regional ECB policy stances. Selling pressure becomes indiscriminate when the benchmark breaks key levels, overwhelming specific currency pair dynamics.
This correlation holds true even when the European Central Bank (ECB) maintains a hawkish tone, proving that DXY momentum is a dominant variable. Used metal and forex trading involves significant risk; capital is at risk.
USD Strength Versus NZD, AUD, and GBP Currencies
Commodity currencies face the steepest losses as yield differentials widen. The US Dollar registered its strongest weekly gain against the New Zealand Dollar, outpacing losses seen in the Euro and Pound. Divergent central bank policies drive the EUR/USD lower, yet the magnitude of USD appreciation varies notably across substantial peers.
Data from the last seven days reveals that the Greenback surged 1.78% against GBP and 2.36% versus AUD, yet these moves trail the collapse in NZD value. If this interest rate differential persists, the market will continue to price in a dominant dollar, forcing pairs like EUR/USD to test lower support levels before any sustainable rebound occurs.
Technical Mechanics of Oversold RSI and Bearish MACD Signals
Defining Oversold RSI and Negative MACD Histogram Mechanics
The Relative Strength Index (14) hovering near 21 screams of extreme selling velocity rather than serving as an automatic buy signal. This mathematical reality shows average losses crushing average gains over the last 14 periods, yet price action frequently drills lower despite this oversold label. Momentum persists because the indicator measures speed, not the exact moment of reversal.
A negative MACD histogram simultaneously confirms that bearish force dominates the current market structure. When this histogram stays below the zero line, the gap between the MACD line and its signal line widens negatively, reinforcing the downward trend. Traders reading these signals must accept that persistent downside pressure overrules standard mean-reversion hopes.
The technical picture remains negative while sellers stay active at key resistance levels. An oversold condition within a strong trend often leads to further declines before any stabilization occurs. Operators waiting for a bullish crossover without price confirmation risk entering prematurely against the dominant flow. Markets can remain irrational longer than a trader can remain solvent, especially when macro drivers like USD strength override technical extremes.
Applying RSI and MACD Confluence to EUR/USD Price Action
Price action near 1.1365 confirms that deeply oversold conditions do not guarantee an immediate reversal. The Relative Strength Index (14) hovering near 21 signals extreme selling velocity, yet the pair dropped another 0.15% as bullish USD momentum overrides standard mean-reversion logic. A negative MACD histogram reinforces this bearish dominance by showing that downside pressure remains intact despite the low reading. Confluence here indicates seller fatigue is building, not that a bottom has formed.
Lag creates the primary problem for those relying solely on momentum signals in trending markets. While the RSI suggests a bounce is due, the broader technical structure warns that prices can remain irrational longer than solvency allows. A potential breakdown could target the 1.06–1.09 range before any sustainable recovery occurs.
Strategic patience is required because entering long positions prematurely against a stabilizing but negative MACD often leads to stop-outs. The 100-period Simple Moving Average on the 4-hour chart acts as a flexible ceiling that price has repeatedly failed to breach. Until EUR/USD reclaims key resistance levels, the path of least resistance remains lower. Traders should wait for a confirmed candle close above the 100-day SMA at 1.1544 to validate a trend change. Ignoring this confirmation in favor of early oversold entries exposes capital to continued distribution. The market demands proof of buyer conviction before rewarding counter-trend attempts.
Risk of Premature Entry Before 100-Period SMA Resistance Tests
Shorting EUR/USD below 1.1500 without a rebound test invites immediate reversal risk against stiff overhead supply. Traders ignoring this protocol often mistake persistent momentum for infinite runway, only to get trapped when price snaps back to the 100-period Simple Moving Average at 1.1544. This flexible level creates a specific failure mode where early bears enter just before liquidity seeks the mean.
The core issue with momentum indicator signals is their inability to distinguish between exhaustion and acceleration during strong trends. An oversold RSI reading suggests sellers are dominant, yet it does not preclude further declines if the 4-hour chart shows repeated rejections at key moving averages.
Operators must wait for price to interact with the 100-day SMA before committing capital to new short positions. Entering prematurely assumes the path of least resistance remains down, ignoring the magnetic pull of the 100-period Simple Moving Average. A decisive break above this level invalidates the bearish thesis entirely. Used metal and forex trading carries significant risk; positions should be sized accordingly to withstand volatility around these critical technical zones.
Strategic Positioning for Bearish Trends and Reversal Points
Defining Valid Bearish Trends via 100-Period SMA Rejection

Sellers seize control when price action repeatedly fails to find acceptance above the 100-period Simple Moving Average on the 4-hour chart. This specific technical failure signals that every rally serves as a fresh opportunity to short rather than a genuine reversal signal. The inability to reclaim the 1.1500 psychological mark reinforces this negative bias, leaving the pair vulnerable amid a bullish US Dollar (USD). A decisive breakdown could propel the currency pair toward the 1.06–1.09 range before any meaningful recovery attempt occurs.
| Signal Type | Threshold Level | Implication |
|---|---|---|
| Trend Filter | 100-period SMA | Rejection confirms bearish dominance |
| Psychological | 1.1500 | Breakdown accelerates selling pressure |
| Momentum | RSI near 21 | Oversold but lacks reversal power |
Holding below this moving average invalidates any bullish thesis regardless of oversold conditions elsewhere. Ignoring this rejection exposes traders to continued downside as momentum indicators like the MACD histogram remain negative. Valid entry requires waiting for a failed retest of the 100-period SMA rather than chasing the initial drop.
Executing Short Positions on EUR/USD After 1.1500 Breakdown
Trigger short entries only after price confirms rejection below the 1.1500 psychological barrier. Spot prices currently hover near 1.1365, extending a negative streak that marks five down-days in the last six sessions. Persistent drift validates the bearish bias despite the Relative Strength Index hovering in oversold territory. Many traders misinterpret deeply oversold conditions as immediate buy signals. Strong momentum can sustain price declines well beyond standard deviation limits. The Moving Average Convergence Divergence histogram remains negative, signaling that downside pressure has not yet exhausted itself.
A valid positioning strategy requires waiting for a modest bounce toward resistance rather than chasing the current low. Any recovery attempt faces a hard ceiling where the 100-period Simple Moving Average converges with prior support levels. Failure to reclaim this zone confirms the trend remains intact for further downside exploration. While short-term patterns are bearish, the broader structure suggests potential volatility if substantial lows hold. A decisive breakdown could eventually target the 1.06–1.09 range before any significant recovery occurs price prediction .
| Condition | Action |
|---|---|
| Price < 1.1500 | Maintain short bias |
| RSI < 30 | Avoid blind longs |
| Break above SMA | Invalidate bear case |
Used forex trading involves significant risk of loss and is not suitable for all investors. Understand the risks before executing positions in volatile markets.
Reversal Risks: Interpreting Oversold RSI Near 21 and MACD Fatigue
Anticipate a potential reversal when the Relative Strength Index lingers near 21 while the MACD histogram stabilizes. Entering short positions immediately carries elevated risk because deeply oversold momentum often precedes a corrective bounce rather than continued decline. The current market structure suggests sellers may face fatigue, making it prudent to wait for near-term consolidation before adding bearish exposure.
While short-term patterns appear bearish, the broader structure could remain intact if price visits channel floors without breaking substantial lows Elliott Wave theory . This tension creates a specific trap for aggressive sellers who ignore stabilizing oscillators. Chasing losses at extreme readings often results in poor entry prices. Price sitting below the 20-day simple moving average can lead to mean reversion attempts moving average. A successful reversal requires reclaiming the 100-day SMA at 1.1544 to shift the bias. Until then, the dominant trend favors bears, but the immediate risk lies in a sharp, liquidity-driven spike higher.
Executing Trades on 4-Hour Charts and Correcting Entry Errors
Implementation: Defining 4-Hour Chart Entry Triggers via 100-Period SMA Rejection
From a technical perspective, repeated failures to find acceptance above the 100-period Simple Moving Average (SMA) on the 4-hour chart favor bearish traders.
- Observe the EUR/USD pair failing to find acceptance above the moving average resistance.
- Note the breakdown below the 1.1500 psychological mark, which supports the bearish outlook.
- Recognize that momentum indicators remain depressed, with the Relative Strength Index (14) lingering in oversold territory near 21.
Traders noting the Asian Session Rejection understand that broken support levels quickly change into active resistance. A decisive move lower could target the 1.06–1.09 range before any recovery attempt emerges. However, the 100-day SMA at 1.1544 remains a key resistance level. The EUR/USD pair would need to reclaim this level to ease current downward pressure and shift the near-term bias in favor of bullish traders.
| Condition | Status | Implication |
|---|---|---|
| Price vs 100-period SMA | Rejected | Bearish Continuation |
| Price vs 1.1500 | Below | Confirmed Breakdown |
| RSI (14) | Oversold | Fatigue Warning |
Used metals and forex trading carries significant risk; positions can move against you rapidly. Islamic accounts avoid swap charges but remain exposed to capital loss. Persistent downside pressure dominates until specific resistance levels are reclaimed.
Applying Oversold RSI Near 21 and Negative MACD to EUR/USD Entries
Price action hovering near 1.1365 confirms that bearish momentum overrides standard rebound signals.
- Monitor the Relative Strength Index (14) while it lingers near 21, noting that deep oversold conditions often precede temporary bounces rather than immediate reversals.
- Observe that the MACD histogram is still negative, suggesting persistent downside pressure.
- It is considered prudent to wait for near-term consolidation or a modest bounce before positioning for further losses, as sellers may soon face fatigue.
| Indicator | Current State | Trading Implication |
|---|---|---|
| RSI (14) | Oversold (~21) | Anticipate consolidation or minor bounce |
| MACD | Negative | Maintain bearish bias on rallies |
| Trend | Down | Sell rallies into resistance |
The critical tension lies in distinguishing between genuine exhaustion and mere pause; selling into a bounce preserves capital compared to chasing the daily decline. Most traders fail by assuming an oversold reading guarantees a bottom, yet strong USD demand keeps pressure intact despite the low reading. Any attempted recovery might continue to face stiff resistance near the 100-day SMA at 1.1544. This approach mitigates the risk of entering too early in a strong directional move.
Correcting Premature Entries Before Near-Term Consolidation Forms
Chasing short positions below 1.1400 exposes traders to violent snap-backs before sellers regroup.
- Wait for the EUR/USD pair to establish a tight range or produce a modest bounce rather than selling into vertical drops.
- Observe how broken support levels at the 1.1433 mark now act as immediate resistance during any corrective recovery.
- Confirm that price action faces rejection near the 100-period Simple Moving Average (SMA) before re-entering short to avoid fatigue traps.
Entering without this confirmation ignores the mechanical reality that deeply oversold conditions often precede temporary equilibriums. The cost of premature positioning is realized when momentum stabilizes, forcing early sellers to cover at a loss.
| Risk Factor | Consequence | Correction |
|---|---|---|
| Premature Shorting | Trapped by bounce | Wait for consolidation |
| Ignoring RSI | False breakdown signals | Confirm RSI stabilization |
| Vertical Entries | Poor risk-reward ratios | Target 1.1433 resistance |
A specific limitation arises when geopolitical headlines drive the US Dollar; algorithms may spike price through technical levels without fundamental follow-through. Traders must distinguish between a true trend continuation and a liquidity hunt that resolves only after near-term consolidation forms. Patience allows the MACD histogram to reset, providing a clearer signal for the next leg down toward 1.1323. Used metals and forex carry significant risk; ensure stops are placed above the most recent swing high to invalidate the bearish thesis.
About
Aisha Rahman, Gold & Commodities Analyst at ForexCFD.top, brings a unique macroeconomic perspective to this EUR/USD analysis. While her primary focus remains on XAUUSD and commodity flows, her deep expertise in safe-haven dynamics and US Dollar strength is directly applicable to substantial forex pairs. The current EUR/USD decline is driven by geopolitical risk premiums and Federal Reserve policy expectations, factors that simultaneously dictate gold prices and currency valuations. In her daily work covering global markets for retail traders across the Gulf and emerging economies, Aisha constantly evaluates how shifting interest rates and risk sentiment impact capital flows. This complete view allows her to contextualize the pair's drop to one-year lows beyond simple technicals. At ForexCFD.top, an independent publication dedicated to regulation-aware market news, her analysis connects these broader commodity and currency correlations. This ensures traders receive factual, educational insights on how bullish USD trends influence both traditional majors and alternative assets.
Conclusion
Sustained momentum at this velocity creates a specific operational failure: liquidity gaps widen during Asian hours, causing stop-losses to trigger at prices far worse than technical models predict. While the broader trend favors the dollar, the cost of chasing vertical drops now outweighs the potential reward as the market digests the sheer scale of recent gains. Traders must recognize that mechanical rejection near moving averages often precedes necessary consolidation periods where range-bound algorithms dominate price action.
Adopt a conditional strategy that prioritizes confirmation over anticipation. Do not add to short positions unless price action explicitly fails to hold above the 1.1433 resistance level after a corrective bounce. This approach respects the reality that deeply oversold conditions on lower timeframes often resolve through sideways movement rather than immediate continuation. Patience here prevents capital erosion from false breakdowns that frequently occur when momentum indicators reset.
Start by mapping the 100-period Simple Moving Average on your 4-hour chart as a flexible ceiling rather than a static target. Wait for the price to approach this level and show clear signs of rejection, such as a bearish pin bar or a failure to close above it, before considering new entries. This single adjustment aligns your execution with the current market structure where the EUR/USD pair remains under pressure but requires technical validation before the next leg down.
Frequently Asked Questions
The dollar gained 2.16% against the Euro while surging 3.16% versus the New Zealand Dollar. This disparity shows commodity currencies face steeper losses, requiring traders to adjust risk exposure when yield differentials widen significantly across major peers.
An RSI near 21 indicates extreme selling velocity rather than an automatic reversal point. Momentum often persists despite this label, so traders should wait for price confirmation above resistance levels before entering long positions against the trend.
The pair must close above the 100-day SMA at 1.1544 to validate a trend change. Failure to break this ceiling suggests sellers remain dominant, meaning any attempted recovery will likely face stiff resistance before testing lower supports again.
This pair accounts for an estimated [a portion](https://www.fxstreet.com/news/eur-usd-price-forecast-loses-traction-to-near-11450-as-bearish-trend-tests-lower-bollinger-support-202606220407) of all transactions, dwarfing EUR/JPY at 4%. Such high liquidity ensures tight spreads but also means global macro shifts impact price action more severely than in niche crosses.
Weekly data shows the Greenback gained 2.16% against the Euro while rising 1.78% versus the Pound. This broad-based strength confirms that capital flight from non-USD assets is accelerating, forcing traders to respect bearish dominance on four-hour charts.
References
- Euro to Dollar (EUR/USD) Forecast & Price Predictions for
- EURUSD Forecast & Predictions for 2026, 2027–2028, and Beyond
- Euro Forecast: Price Outlook & Future Predictions | Capital.com
- EUR/USD Technical Outlook: Expert Forex Analysis and Predictions: EUR/USD
- EUR/USD: Toward a new balance by 2026: The EUR/USD
- EURUSD forecast & price predictions for 2026, 2027 -