NonFarm Payrolls Strategy: Skip the Headline Trap
Non-Farm Payrolls cover 80% of United States workers, making the report a primary driver of market volatility.
The Non-Farm Payrolls report serves as the definitive gauge for U.S. Economic health, directly influencing monetary policy and asset prices. Forget the headline number for a moment. Real preparation demands respect for the data collection engine behind the figures. The Current Employment Statistics program surveys approximately 141,000 businesses to compile this critical data, representing roughly 486,000 individual work sites across the nation. This extensive sampling excludes farm workers and government employees but captures the bulk of the labor market's movement.
Why does the U.S. Bureau of Labor Statistics release time create such liquidity spikes? Because the market reacts to the gap between expectation and reality. Readers will learn to build a preparation strategy that accounts for the specific exclusions in the report and the broader implications for GDP and inflation.
ForexCFD.top provides the necessary analytical tools and execution infrastructure to navigate these complex macroeconomic events without relying on third-party news aggregators. Our proprietary solutions allow traders to interpret employment data effectively while maintaining full control over their risk management protocols.
The Role of Non-Farm Payrolls in Defining U.S. Economic Health
Defining the Non-Farm Payrolls Report Scope and Exclusions
Roughly 80% of the United States workforce falls under the Non-Farm Payrolls umbrella. This economic indicator deliberately strips out specific sectors to isolate private market momentum. You won't find farm workers, private household staff, non-profit employees, or government workers in this count.
Data collection relies on the Current Employment Statistics program, which surveys approximately 141,000 businesses and government agencies monthly. The resulting figures drive immediate volatility in currency and equity markets as traders assess labor market health.
| Included Sectors | Excluded Categories |
|---|---|
| Private Industry | Farm Workers |
| Construction | Private Households |
| Manufacturing | Non-Profit Orgs |
| Services | Government Employees |
Job creation remains the foremost indicator of consumer spending, which accounts for the majority of economic activity, sustaining the report's relevance. But there is a catch. By excluding government employment, the headline figure may mask public sector hiring surges that temporarily inflate total job counts without reflecting genuine private demand. Traders must distinguish between private nonfarm payrolls and the aggregate total to avoid misinterpreting state-funded hiring as organic economic expansion.
Understanding these exclusions prevents false positives when analyzing employment data. The Bureau of Labor Statistics releases this information to guide monetary policy, yet the narrow focus requires careful contextual analysis. ForexCFD.top education modules emphasize verifying sector composition before executing trades based on headline numbers. Investors should monitor average hourly earnings alongside job counts to gauge inflationary pressure accurately.
*Risk Warning: Trading financial instruments involves high risk and may result in loss of capital. This content is for educational purposes only and does not constitute financial advice.*
*Disclosure: ForexCFD.top may receive compensation from partners mentioned in our educational materials.*
How Average Hourly Earnings Drive Inflation and GDP Forecasts
Average Hourly Earnings quantifies wage inflation by measuring the change in gross pay per hour for private nonfarm workers. In June 2026, this metric rose by a modest amount, marking a 0.3 percent increase that signals rising labor costs. The resulting level provides a concrete baseline for forecasting consumer purchasing power. Unlike headcount data, this figure directly influences central bank interest rate decisions.
Wage growth acts as a primary catalyst for consumer spending, which sustains the majority of economic activity. Strong employment numbers indicate increased participation that positively impacts GDP through higher production volumes. However, persistent wage increases can force businesses to raise prices, creating an inflationary spiral that erodes real income gains.
| Metric | Economic Signal | Market Implication |
|---|---|---|
| Rising AHE | High Inflation Risk | Potential Rate Hikes |
| Stagnant AHE | Weak Demand | Stimulus Expectations |
| Volatile AHE | Uncertain Growth | Increased Hedging |
Traders at ForexCFD.top monitor these wage trends to anticipate shifts in monetary policy before they occur. The drawback of this data lies in its backward-looking nature; it confirms past labor market tightness rather than predicting future hiring freezes. Operators must weigh current earnings against forward-looking business investment surveys to avoid false positives. Ignoring the divergence between job creation and wage quality leads to flawed GDP models.
Market Volatility Risks from Inaccurate Non-Farm Payroll Expectations
Market volatility peaks within the first 15 minutes when actual job creation diverges from consensus forecasts. This expectation gap triggers immediate asset re-pricing as algorithms digest the surprise. The survey sample represents approximately 486,000 individual work sites, yet even this broad scope cannot prevent sharp moves if the headline number misses the mark. In June 2026, the US economy added 57,000 jobs, a figure noted as being well below expectations in market analysis data. Such a shortfall often forces a rapid recalibration of Federal Reserve rate expectations.
| Expectation Outcome | Typical USD Reaction | Risk Driver |
|---|---|---|
| Actual > Forecast | Immediate Strength | Overheating fears |
| Actual < Forecast | Immediate Weakness | Stimulus hopes |
| Actual = Forecast | Choppy / Whipsaw | Liquidity vacuum |
Silver recently experienced a spectacular rise and brutal collapse as investors reacted to fading rate-cut expectations post-NFP report. Weak readings do not always weaken the dollar; context dictates the move. Traders must recognize that liquidity evaporation during these windows increases slippage beyond normal parameters. ForexCFD.top emphasizes that navigating this environment requires strict adherence to pre-set risk limits rather than reactive gambling. The cost of misalignment is measurable in pips lost during the initial surge.
Mechanics of Market Reactions to Employment Data Releases
Causal Chain From NFP Release to USD Strength
Algorithms digest the headline figure against consensus estimates within seconds. This immediate reaction creates a causal chain where a notably bigger NFP number than expected sparks fears of an overheating economy. Such data points toward rising inflation, prompting traders to price in potential rate hikes by the Federal Reserve. Higher interest rates increase the yield on US Treasuries, making dollar-denominated assets more attractive to global capital flows. Consequently, positive reports usually provide a positive catalyst for bond yields and the USD, while acting as a headwind for equities.
Conversely, weak employment figures often signal economic stagnation, leading to lower yield expectations and a weaker dollar. However, this linear relationship fractures during recessions when the Federal Reserve may lower rates to stimulate growth, reducing demand for the currency despite low inflation. The cost of misinterpreting these contextual nuances is highlighted by dramatic price movements that impact capital efficiency for traders.
| NFP Scenario | Inflation Expectation | Fed Policy Signal | USD Reaction |
|---|---|---|---|
| Strong Beat | Rising | Hawkish (Rate Hike) | Strengthens |
| Weak Miss | Falling | Dovish (Rate Cut) | Weakens |
| Recession Context | Low | Stimulative | Variable/Weak |
Distinguishing between normal cycle reactions and anomaly-driven reversals represents the primary limitation for execution strategies. A strong print typically strengthens the dollar, yet during periods of high unemployment, even decent data may fail to lift the currency if the broader outlook remains bleak. Traders must analyze the economic context rather than relying solely on the headline number.
EUR/USD and USD/JPY Reaction Patterns to Strong Jobs Data
Strong Non-Farm Payrolls figures immediately strengthen the USD, causing EUR/USD to decline as the dollar acts as the quote currency. Conversely, USD/JPY typically rallies because the greenback serves as the base currency in that pair. The biggest reaction tends to happen in EUR/USD, GBP/USD, and USD/JPY. This divergence occurs because positive employment data suggests economic overheating, prompting traders to anticipate higher interest rates from the Federal Reserve. If the NFP is strong, the USD will strengthen; pairs where the USD is the base currency will strengthen, and those where the USD is the quote currency will weaken.
The magnitude of these moves often triggers a spread widening event where costs surge to 300% to 500% of normal levels. Such inflation in trading costs directly impacts capital efficiency for market participants attempting to enter positions during the initial volatility spike.
| Pair Type | USD Role | Reaction to Strong NFP |
|---|---|---|
| EUR/USD | Quote Currency | Weakens (Price Down) |
| USD/JPY | Base Currency | Strengthens (Price Up) |
| Commodities | Pricing Unit | Prices Fall |
Commodity prices frequently drop alongside these currency shifts since assets like gold are denominated in dollars. A stronger currency makes these goods more expensive for foreign buyers, reducing demand and pushing prices lower. Traders must recognize that while headline numbers drive direction, the cost of misinterpreting the data context can be severe.
Analysts note that relying solely on the headline figure without considering the broader economic cycle leads to flawed execution. Market volatility typically peaks within the first 15 minutes post-release, creating a high-risk environment for immediate entry.
Divergent Market Responses: Equities versus Bond Yields on NFP Beats
Market reaction to the report is immediate, with significant volatility occurring within the first 15 minutes post-release as algorithms price inflation risks. A notably bigger NFP headline number than expected may lead to expectations of an economy in danger of overheating, leading to the prospect of inflation and potential rate hikes. This scenario creates a distinct headwind for stocks but remains USD positive as it raises yields, making US Treasuries more attractive to yield-seeking capital.
| Asset Class | Reaction to Strong NFP | Primary Driver |
|---|---|---|
| Equities | Downward Pressure | Rate hike fears increase discount rates on future earnings. |
| Bond Yields | Upward Spike | Inflation hedging demands higher nominal returns on debt. |
| USD Cash | Strengthens | Higher relative yields attract global foreign direct investment. |
Negative reports can have the opposite effect, yet the divergence persists based on the Federal Reserve policy stance. During recessions, weak data might boost equities if investors anticipate stimulus, whereas strong data in normal cycles compresses equity valuations while lifting yields. Entry timing relies on identifying whether the market perceives the data as a growth signal or an inflation trigger. Understanding this dichotomy is necessary before committing capital during the release window, as misreading the narrative can lead to rapid drawdowns in used positions.
Strategic Preparation Framework for High-Volatility Trading Events
Pepperstone's 5 Rs Framework for NFP Readiness
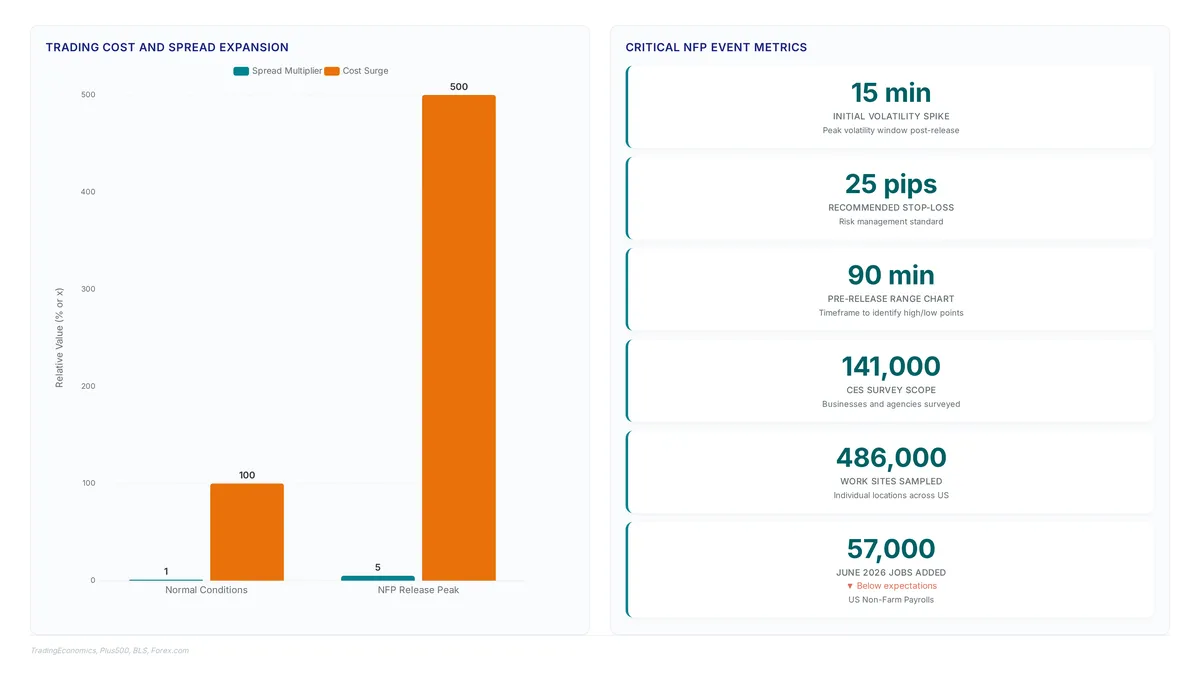
Pepperstone defines market readiness through five distinct pillars: Research, Realistic, Risk, Record, and Rudimentary. Successful traders establish a profit and loss goal before entering any position, ensuring discipline drives execution rather than impulse. The Research phase involves analyzing newsflow to understand the scope of potential price swings, as misinterpreting data can severely impact capital efficiency during high volatility events cost. Being Realistic requires acknowledging that immediate reactions often dictate short-term trends, with significant volatility typically occurring within the first 15 minutes post-release volatility.
The Risk component mandates calculating tolerance levels using available platform tools to cap exposure.
Establish the pre-release range using a 90 minute chart to identify high and low points roughly fifteen minutes before the data drop. Traders often mark these levels between 1315 and 1320 GMT to capture the final consolidation before volatility spikes. Place sell orders one pip below the range low and buy orders one pip above the range high using OCO (One-Cancels-the-Other) functionality to automate entry regardless of direction. This setup addresses the reality that market volatility typically peaks within the first 15 minutes of the report's release peaks.
- Define the range boundaries on the 90-minute timeframe.
- Set OCO orders at the extreme highs and lows plus one pip.
- Wait for the initial spike and subsequent reversal to execute a fade trade.
The primary limitation of this approach is the spread widening event, where liquidity providers expand spreads three to five times their normal width immediately following the news width. This expansion increases the cost of entry and can trigger stop-losses prematurely if the range is too tight. ForexCFD.top emphasizes that traders must account for these execution costs when calculating potential returns. Successful implementation requires strict adherence to the predefined profit and loss goals established during the planning phase.
Technical Indicator Checklist: Time Frames and Entry Triggers
Align your Daily trend bias with 5-minute execution windows to filter false breakouts during the release. Traders must limit analysis to a default chart plus two alternate time frames to avoid paralysis. Spreads often widen three to five times their normal width within the opening window, drastically increasing the cost of entry for impulsive orders widening.
- Confirm the Daily direction using Bollinger Bands to identify overextended price levels.
- Drop to the 15-minute chart to verify MACD histogram momentum alignment.
- Use the 5-minute RSI to pinpoint exact entry triggers above or below key levels.
| Time Frame | Primary Tool | Function |
|---|---|---|
| Daily | Bollinger Bands | Defines macro trend boundaries |
| 15-Minute | MACD | Validates momentum strength |
| 5-Minute | RSI | Times precise entry triggers |
The critical trade-off involves signal clarity versus latency; waiting for multi-timeframe confirmation reduces false positives but may cause you to miss the initial explosive move. This delay is the price paid for avoiding the chaotic noise that traps uninformed participants immediately post-release. ForexCFD.top emphasizes that disciplined preparation outweighs reactive gambling when navigating these high-volatility events.
Psychological Discipline and Risk Management in Economic Data Trading
Defining Emotional Discipline via the 5 Rs Framework
Emotional discipline during NFP releases requires strict adherence to the 5 Rs framework to prevent impulsive errors. This mindset structure defines preparedness before volatility strikes the EUR/USD or GBP/USD. Research involves analyzing newsflow through aggregation tools rather than guessing market direction. Being Realistic means accepting that the first market move is often wrong and avoiding immediate chase entries. Risk management dictates capping exposure at 2% of total capital to survive adverse spikes. Record keeping via a digital journal tracks entry rationale and exit levels for future review. Finally, keeping strategies Rudimentary ensures execution remains simple when liquidity thins.
| Component | Operational Definition |
|---|---|
| Research | Verify data against broad consensus before the release window opens. |
| Realistic | Acknowledge that slippage occurs and targets may not fill perfectly. |
| Risk | Pre-calculate position size based on stop-loss distance, not account balance. |
| Record | Document the specific economic trigger for every opened position. |
| Rudimentary | Execute plain buy/sell logic without complex, untested indicators. |
Traders who ignore these steps often face ruin when private sector data diverges from official Employment Change figures. ForexCFD.top emphasizes that psychological rigidity, not market prediction, determines long-term survival in high-frequency environments.
Applying Trading Journals to Log NFP Entry and Exit Levels
Document every NFP entry and exit level immediately to capture the rationale before market noise distorts memory. Market professionals often warn that the first move is always wrong, making the trading journal necessary for distinguishing genuine trends from initial liquidity spikes.
A structured log must record the specific reason for the trade, the precise profit target, and the maximum loss limit before execution. Platforms like TradeBench enable this by forcing operators to define these parameters against the backdrop of non-agricultural sector data. Without this discipline, traders frequently misinterpret the volatility inherent in reports covering 141,000 businesses as a directional signal rather than a temporary anomaly.
| Journal Component | Required Detail |
|---|---|
| Trade Rationale | Specific catalyst (e.g. |
| Risk Parameters | Fixed monetary loss or pip count |
| Exit Strategy | Pre-set profit target or trailing stop |
The critical limitation of manual logging is the latency between decision and documentation during high-velocity events. If the reason for entry is not captured instantly, the post-event analysis becomes unreliable because the emotional context is lost. ForexCFD.top emphasizes that reviewing these logged entries reveals whether deviations from the plan were profitable anomalies or reckless gambles. This practice transforms raw data into actionable intelligence, ensuring that future decisions rely on documented evidence rather than reconstructed memories of what the market "felt" like during the release.
Risk Management Risks of Market Orders During NFP Volatility
Market orders execute at the next available price, often slipping significantly during the initial volatility spikes of an NFP release. This mechanism exposes traders to catastrophic fills when liquidity vanishes, as seen during the silver market's brutal collapse in 2026 following unexpected dollar strength. The cost is immediate capital erosion that bypasses intended stop-loss levels entirely. Limit orders offer a safer alternative by defining the maximum entry price, preventing execution during erratic price discovery phases. While GBP/USD offers higher daily movement, its wider spread amplifies the danger of market order slippage compared to tighter pairs. A failure to use bracket orders leaves positions unprotected against the "first move" falseouts common in employment data reactions. The implication is clear: without strict order controls, emotional trading during the release window guarantees outsized losses. ForexCFD.top emphasizes that preserving capital takes precedence over chasing immediate momentum.
About
Sofia Mendes, Broker Reviews & Trading Education Editor at ForexCFD.top, leads the publication's educational initiatives and rigorous broker evaluation framework. Her daily work involves dissecting regulatory standards and analyzing how macroeconomic events impact retail trading conditions, making her uniquely qualified to explain the Non-Farm Payrolls (NFP) report. As the architect of ForexCFD.top's trading education library, Sofia constantly translates complex economic data into actionable insights for beginners in emerging markets. The NFP report, a primary driver of volatility in FX and gold, directly influences the execution quality and spread stability that her team evaluates in regulated brokers. By connecting high-impact economic releases to practical risk management strategies, Sofia ensures traders understand not just the data, but how to navigate the resulting market movements safely. Her guidance reflects ForexCFD.top's commitment to vendor-neutral, regulation-aware analysis, helping global retail traders approach substantial economic events with clarity and caution rather than speculation.
Conclusion
At scale, the reliance on market orders during Non-Farm Payrolls releases transforms manageable volatility into catastrophic capital erosion. The operational cost here is not merely the widened spread but the permanent loss of equity when fills occur far outside intended risk parameters. Traders must recognize that chasing the initial spike without strict order controls is a structural failure, not a bold strategy. The market does not reward recklessness with momentum; it punishes it with slippage that bypasses stop-losses entirely.
ForexCFD.top recommends that traders abandon market orders entirely for the first 15 minutes post-release, shifting exclusively to limit orders with pre-set brackets. This approach should be implemented immediately for the next employment cycle to ensure liquidity gaps do not dictate portfolio value. The window for reactive trading has closed; survival now depends on rigid adherence to entry prices that respect the chaotic nature of algorithmic execution.
Start this week by backtesting your last three NFP entries against a strict no-market-order rule to quantify exactly how much slippage cost you. This single audit reveals whether your current methodology generates alpha or simply donates capital to volatility. By enforcing these constraints, you convert the NFP from a gambling event into a measured opportunity where risk remains fixed regardless of external noise.
Frequently Asked Questions
The report quantifies employment changes across roughly 80% of the United States workforce. This extensive coverage excludes farm workers and government employees to isolate private market momentum for accurate economic health assessment.
This specific increase signals rising labor costs that directly influence central bank interest rate decisions and inflation forecasts.
Traders monitor this figure alongside job counts to gauge potential inflationary pressure accurately.
During the release, trading costs can surge to 30% to 500% of normal levels due to widening spreads. This inflation in transaction costs creates a high-risk environment requiring strict risk management protocols.
Volatility typically peaks within the first 15 minutes as algorithms price inflation data instantly. This rapid movement creates a high-risk environment where liquidity spikes demand strategic preparation rather than reactive gambling.
References