Rate expectations stall USD/INR near 95.10 level
Traders face a 62% probability of a September rate hike as the Federal Reserve pins expectations higher.
The USD/INR pair sits in a tight range, caught between hawkish FOMC dot plots and collapsing oil prices. The greenback gains ground as interest rate expectations reprice, yet the Indian Rupee finds a floor because energy costs have retreated to pre-war levels. This conflict creates a stalemate. Buyers and sellers refuse to commit without a definitive catalyst.
Here is the reality: macro fundamentals are forcing this consolidation. The pair cannot break key technical barriers because the drivers are pulling in opposite directions. Downward momentum hits a wall at the 95.10 level, where trendlines converge. Until high-impact US data releases like the NFP report force a hand, the market remains stuck.
Volatility is a trap here. A mere 32 bps of tightening is already priced in by year-end according to recent trading data. Without upside surprises in upcoming inflation or employment figures, the USD/INR exchange rate will oscillate within these boundaries rather than trend.
The Role of Macro Fundamentals in Defining USDINR Rangebound Behavior
Defining Rangebound USDINR Behavior Amid Hawkish FOMC Dot Plots
Falling oil prices currently offset dollar strength from hawkish Fed signals, creating a temporary equilibrium for USD/INR. This technical stall emerges as the Indian Rupee resists broader regional weakness despite structural bearish trends affecting local currency pairs. Market participants price in varied expectations for US central bank borrowing costs through year-end 2026. Probability metrics indicate shifting likelihoods for rate adjustments in coming months, generating divergent timelines that support a congestion zone. Traders await definitive US data catalysts before committing capital within this environment. The FOMC dot plot acts as the primary anchor, keeping real yields elevated while energy costs decline. Global commodity flows interact with central bank guidance to define immediate trading range boundaries.
How Pre-War Oil Levels Support INR Against Hawkish USD Repricing
Cheaper energy imports directly improve the Indian trade balance, offering fundamental support to the local currency. As oil markets retreat to pre-war levels, this flexible creates specific tension where energy-driven inflows counteract the gravitational pull of tightening US monetary policy. The Federal Reserve maintains a federal funds rate target range of 3.50% - 3.75%, a stance that typically drives capital toward dollar-denominated assets. Yet the Rupee demonstrates durability, outperforming regional Asian peers which falter under similar pressure. This divergence suggests likely intervention by the Reserve Bank of India successfully stabilizes the pair despite the hawkish backdrop. Market participants continue pricing in probabilities for further rate increases while cheaper energy acts as a powerful counter-weight. Traders interpreting CPI impact on the USD must weigh domestic inflation data against these external commodity flows. A hot inflation print could strengthen the dollar, yet sustained low oil prices may limit upside for USD/INR.
Dip-Buyer Risks When NFP and CPI Surprises Break USDINR Equilibrium
Upward movement in rate expectations now strictly requires positive data shocks to overcome the near-term peak in pricing. Critical US inflation data serving as a volatility catalyst is scheduled for release on June 10, 11, 2026, creating a narrow window for breakout validation. The market awaits key reports including the US NFP and Jobless Claims figures later in the week to determine the next direction. Buyers leaning on minor trendlines face significant risk if these prints miss consensus estimates. Sellers watch for breaks lower to target the 94.00 handle next. Structural bearishness remains intact for the pair over the long-term. Dip-buyers will likely seek opportunities around strong technical levels to push the USD/INR pair into new highs only after confirmation.
Multi-Timeframe Technical Structure Reveals Critical Resistance at 95.10
Defining Confluence Between Daily Trendlines and 4-Hour Resistance Zones
Confluence occurs where the substantial downward daily trendline intersects the 95.10 resistance zone. On the daily chart, USDINR consolidates just below the 95.00 handle while this diagonal barrier defines current bearish momentum. The 4-hour chart highlights a stronger rejection area around 95.10 that coincides with the same descending slope. This overlap creates a high-probability reversal pocket because sellers defend the level across two distinct time horizons simultaneously.
| Feature | Daily Timeframe | 4-Hour Timeframe |
|---|---|---|
| Primary Structure | Substantial downward trendline | Strong resistance zone |
| Key Level | 95.00 consolidation | 95.10 confluence area |
| Bearish Target | New lows | 94.00 handle |
| Bullish Trigger | Break above trendline | Break into new highs |
Traders must distinguish between minor pullbacks and structural shifts when price approaches this nexus. A false break above the 95.10 mark without sustained momentum often traps aggressive buyers before a reversal. The limitation of this setup is that waiting for confirmation can reduce reward-to-risk ratios if the move accelerates quickly. External volatility catalysts like critical US inflation data scheduled for mid-June could invalidate technical boundaries entirely. Operators should monitor the 94.00 support level as the primary downside objective if sellers respect the confluence. Failure to hold the trendline invalidates the bearish thesis and opens a path toward 96.00.
Executing Trades Using 1-Hour Pullbacks to the 95.10 Resistance Level
A minor upward trendline on the 1-hour chart currently guides the pullback toward the 95.10 resistance. Traders execute entries by waiting for price to touch this diagonal support before testing the confluence zone.
- Identify the upward trendline connecting recent 1-hour lows leading into the 95.10 area.
- Monitor price action for a rejection candle or momentum stall at the 95.10 intersection.
- Enter short positions only after a break lower, targeting the 94.00 handle as sellers step.
Sellers define risk above the trendline, anticipating that the broader bearish momentum will resume. This approach isolates the tactical entry point within the larger rangebound consolidation. The limitation is clear: a decisive break above 95.
Used metals and forex trading involve significant risk; capital is at risk.
False Breakout Risks When USDINR Tests the 95.00-95.10 Supply Block
Price briefly piercing the 95.00 handle before reversing traps aggressive buyers who misinterpret the move as a genuine breakout. This specific failure mode occurs when liquidity probes the 95.10 supply block without sustained momentum to clear the downward trendline. Sellers rely on this daily barrier to push prices lower, while buyers require a confirmed break higher to open doors for new rallies. The danger intensifies around scheduled data releases, where volatility costs spike and whipsaws become frequent. Traders often mistake a transient spike for the 62% probability event of a September rate hike, only to face an immediate reversal when the catalyst fails to materialize.
The mechanism involves a liquidity grab above the trendline followed by a rapid reclaim of the range interior.
- Price tags the 95.10 confluence zone on thin volume.
- Stop-loss orders above the high are triggered, fueling a short-term spike.
- Institutional sellers enter short positions as price falls back below the trendline.
However, the cost of trading this setup is the risk of holding through a genuine breakout if US inflation data surprises to the upside. Unlike a clean trend continuation, this environment demands strict invalidation above the daily swing high. The implication for operators is clear: wait for a close above the supply zone rather than trading the initial touch. Used positions face heightened liquidation risk during these fake-outs.
Strategic Execution for Trading USDINR Breakouts Ahead of US Data
Defining the 95.10 Confluence Zone for USDINR Breakouts
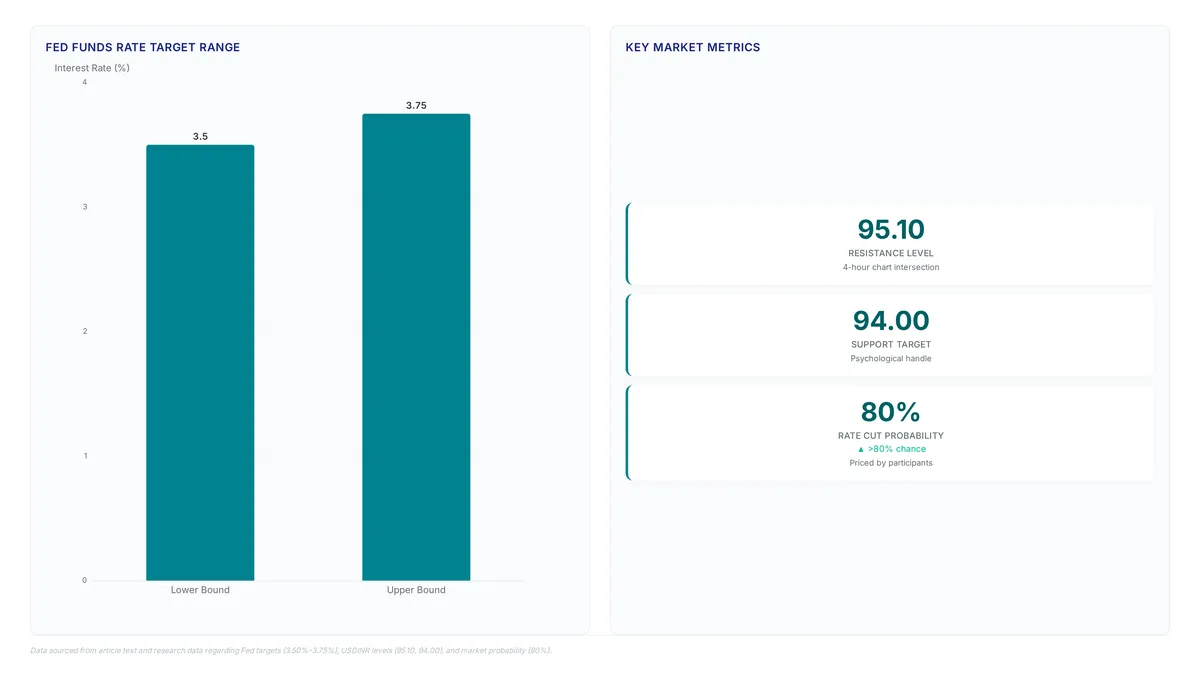
The 95.10 resistance level marks the precise technical intersection where price action meets the downward trendline on the 4-hour chart. This confluence creates a zone where sellers may defend structural levels before substantial US data releases. Traders anticipating a breakdown should watch for a failure to sustain above this line, targeting a return to the 94.00 psychological handle. Conversely, a decisive close above this area invalidates the bearish structure and opens liquidity toward fresh highs.
Timing entries requires patience as the market awaits directional clarity from the scheduled economic calendar. Wednesday features the US ADP report and the US ISM Manufacturing PMI, setting the stage for later volatility. This tension creates a rangebound consolidation pattern that demands strict adherence to set risk parameters. Operators should note that further upward movement in rate expectations may require upside surprises in upcoming reports, while the greenback could see consolidation without a meaningful catalyst.
| Scenario | Trigger | Target |
|---|---|---|
| Bearish Rejection | Failure at 95.10 | 94.00 |
| Bullish Breakout | Close above trendline | New Highs |
Used metals and currency pairs carry significant risk; ensure capital adequacy before engaging near technical inflection points. Market participants should remain aware that the cost of holding USD positions is influenced by the federal funds rate target range, setting the baseline for borrowing costs.
Executing Entry Strategies Ahead of US Job Openings and NFP
Price action clustering near the 95.10 resistance dictates immediate tactical patience before scheduled data releases. Tomorrow's US Job Openings report initiates a volatility sequence that extends through Thursday's Non-Farm Payrolls. Traders often incur elevated positioning costs when entering ahead of such clustered catalysts, as liquidity providers widen spreads to manage risk exposure. A breakout entry requires a confirmed four-hour close above the trendline confluence rather than a mere spike.
Thursday also includes the release of the US Jobless Claims figures alongside the NFP report, compounding the potential for market movement. While a sustained rally may follow upside data surprises, price action has recently become rangebound as the surprisingly hawkish FOMC decision boosted the US dollar. Waiting for confirmed price action offers a disciplined approach compared to chasing the first candle.
| Data Event | Strategic Focus |
|---|---|
| Job Openings | Liquidity check for range expansion |
| ADP Report | Private sector employment proxy |
| NFP Release | Primary volatility trigger |
The limitation of pre-NFP positioning is the uncertainty surrounding gap risk during the news window. If price fails to hold above 95.10 post-release, the path of least resistance reverts to the 94.00 support level. Successful execution demands strict adherence to the confirmed break rather than anticipating the move.
Validation Checklist for Targeting the 94.00 Handle on Breakdown
Sellers are anticipated to enter at the 95.10 confluence with set risk above the trendline, targeting a drop to the 94.00 handle. This breakdown strategy requires strict validation to avoid false signals common in rangebound markets.
| Condition | Validation Signal | Risk Action |
|---|---|---|
| Trendline Test | Price rejects 95.10 zone | Place stop above swing high |
| Momentum Shift | Four-hour close below support | Enter short on retest |
| Catalyst Alignment | Weak US data beats estimates | Tighten trailing stops |
Traders should monitor oil prices, as the Rupee has been supported by falling crude values that have reached pre-war levels. Positioning ahead of the FOMC meeting often incurs hidden costs as liquidity providers widen spreads to manage volatility. A failure to break the 95.10 resistance confirms the bearish structure remains intact for a move lower. Conversely, a decisive close above this level invalidates the breakdown thesis entirely.
The primary limitation of this approach is the potential for reversals if upcoming employment data surprises to the upside, given that further hawkish repricing may depend on NFP and CPI reports. Operators should wait for the four-hour close to filter out noise before committing capital. This patience helps avoid entering during periods of low liquidity that can occur before substantial releases like.
Risk Management Protocols for False Breakouts and Consolidation Traps
Defining False Breakout Mechanics Below the 95.00 Handle
A false breakout occurs when price pierces a key level but fails to sustain momentum due to pending economic data. On the daily chart, USDINR is consolidating just below the 95.00 handle, creating a fragile equilibrium where sellers rely on the trendline while buyers await confirmation. This mechanical failure often traps used positions that enter on the initial pierce without volume validation.
Traders face hidden costs when liquidity thins ahead of scheduled releases:
- Spreads may widen as market participants adjust positioning before US data.
- Stop-loss orders cluster near technical levels, providing fuel for reversals.
- Opportunity cost rises as capital remains tied in stagnant ranges.
Thin order flow around the 95.00 handle invites volatility spikes when US Job Openings and Consumer Confidence data release tomorrow. These catalysts frequently trigger false breakouts that trap traders entering positions during low-liquidity consolidation. Market makers often widen spreads ahead of such events, creating a trap where price pierces the trendline only to reverse sharply once volume evaporates. This environment penalizes premature entries that lack confirmation from sustained volume.
Traders facing a fix incorrect trade entry scenario must recognize specific hidden costs during these traps:
- Slippage expands rapidly as liquidity providers withdraw depth.
- Stop-loss clusters below technical levels become targets for reversal.
- Capital remains tied in stagnant ranges while opportunity costs mount.
However, waiting for absolute confirmation risks missing the initial leg of a genuine move if surprise data aligns with the structural trend. A break above the 95.10 resistance zone requires volume validation to confirm buyer conviction rather than a fleeting liquidity grab. Until then, the rangebound nature persists, reflecting a tactical pause rather than a trend reversal. Investors should await clear directional cues from upcoming US data before committing to breakout strategies.
Validating Trendline Breaks Against NFP and Jobless Claims Timing
Price piercing the 95.00 resistance lacks validity unless it occurs outside the Thursday NFP and Jobless Claims window. Traders often mistake initial volatility for genuine momentum, yet false breakouts frequently trap premature entries during these high-impact releases. The mechanism of failure involves algorithmic liquidity sweeps that trigger stop-loss clusters before reversing direction.
| Event Timing | Breakout Validity | Operational Risk |
|---|---|---|
| Pre-NFP (0-15m) | Low | High slippage on thin order books |
| Post-Claims (>30m) | High | Reduced gap risk exposure |
| Non-Data Hours | Medium | Gradient drift without volume |
However, waiting for confirmed close candles sacrifices entry precision, a trade-off where patience reduces win-rate frequency but improves capital preservation. The cost of uncertainty acts as a premium on hedging, making fixed-rate strategies attractive before the July 29 Fed decision unknown. This environment penalizes used positions that ignore the temporal constraint of data releases.
- Verify volume spikes exceed the 15-minute average before entry.
- Wait for the 15-minute candle closure beyond the trendline.
- Cross-reference the break with real-time EUR/USD stabilization signals.
Most operators find that breaks occurring during the release window often fail to sustain momentum toward 96.00. Genuine trend changes typically manifest after the initial data shock absorbs, leaving late traders exposed to reversal risk. Avoiding the immediate release window filters noise from signal effectively.
About
Aisha Rahman, Gold & Commodities Analyst at ForexCFD.top, brings a unique macroeconomic perspective to the analysis of the USD/INR pair. While her primary focus remains on precious metals and energy markets, her deep expertise in safe-haven flows and commodity-currency correlations is directly applicable to emerging market forex dynamics. The Indian Rupee's current rangebound status is heavily influenced by global oil prices and US Federal Reserve policy, both of which are central to Aisha's daily research on XAUUSD and crude oil. Her work at ForexCFD.top involves dissecting how FOMC decisions and energy market volatility impact Tier-2 and Tier-3 currency pairs, providing critical context for retail traders in India and the Gulf. By connecting broad commodity fundamentals to specific FX movements, Aisha offers readers a complete view of how global risk sentiment drives the USD/INR trajectory, ensuring analysis that is both technically sound and grounded in real-time market drivers.
Conclusion
The USD/INR pair faces a structural ceiling where technical confluence meets macroeconomic reality. While the 4-hour rejection zone offers a tempting short, the underlying federal funds rate stance of 3.50% to 3.75% ensures that any breakdown remains vulnerable to sudden capital inflows. This disconnect creates a dangerous environment for used positions that ignore volume verification. The operational cost here slippage, but the erosion of capital during algorithmic liquidity sweeps that target stop clusters before any genuine trend emerges.
You must prioritize capital preservation over entry precision until the data window clears. Do not commit to a breakout strategy until price action closes beyond the trendline outside the high-impact release window. Your immediate action this week is to filter all potential entries by verifying that volume spikes exceed the 15-minute average before execution. This discipline separates noise from signal in a market driven by hawkish repricing rather than fundamental reversal.
Frequently Asked Questions
Traders currently see a 62% chance of a rate move in September. This high probability suggests the market expects significant tightening later in the year rather than immediate action.
Only 29% of traders are pricing in a rate hike for July. This low percentage indicates that most market participants do not expect the central bank to act this summer.
The target range sits between 3.50% and 3.75% currently. This specific stance typically drives capital toward dollar assets, supporting the greenback against emerging market currencies like the Rupee.
Strong resistance exists where the daily trendline meets the 95.10 level. This confluence creates a difficult barrier for buyers to overcome without a major positive data shock.
Falling oil prices provide fundamental support that counters dollar strength. This dynamic creates a stalemate where energy cost reductions neutralize the impact of hawkish Federal Reserve interest rate signals.
References