EUR/GBP Neutral: Watch 0.8680 Resistance Break
EUR/GBP trades neutral after failing to hold 0.8680 resistance, per ActionForex data.
This analysis asserts that the pair remains trapped within a set consolidation range until a decisive break of key technical levels occurs. Traders will learn how to map the critical support framework around the 38.2% retracement level at 0.8618 and interpret the mechanics of a potential trend reversal if price action violates this zone. We will evaluate specific bullish scenarios requiring a firm break above 0.8680 to target 0.8863, alongside bearish outcomes that could drive rates toward the 61.8% retracement near 0.8466.
While EUR/GBP accounts for roughly a small fraction of global transactions compared to the dominant EUR/USD (EUR/GBP), its current volatility demands precise strategic positioning. ActionForex notes that long-term range trading persists between 0.8201 and 0.9499, a pattern established since the 2008 high. Understanding these boundaries is necessary for navigating the immediate neutral bias identified for the week.
Defining the Critical Resistance and Support Framework for EUR/GBP
Defining the 0.8680 Resistance and 0.8600 Support Pivots
Sellers aggressively defended the 0.8680 resistance last week, creating a precise ceiling where recent bullish momentum stalled and failed to sustain above this barrier. This level represents a technical failure point that defines the current upper bound for price action while the immediate neutral bias suggests caution before committing to a directional breakout. Market participants remain sensitive to moves near this boundary even as the 0.8600 support acts as a primary pivot for sentiment below. Technical analysis identifies a decisive break of the nearby 0.8610 support as the specific trigger that would revive the case for a bearish trend reversal. Tension builds within the narrow range between these pivots where price action often generates signals before a true trend emerges. Holding above current support levels prevents a deeper decline while a drop targets deeper Fibonacci extensions. Specifically, a move lower could test the 61.8% retracement target near 0.8466, defining the potential cost of a failed support test. The market remains trapped in a consolidation pattern dictated by these key technical levels until either boundary yields.
Applying the Neutral Bias to 0.8680 Breakout Scenarios
Traders must treat the 0.8680 resistance as a binary switch for trend validation rather than a soft barrier when applying a neutral bias. This specific price point acts as the definitive trigger where market indecision resolves into directional momentum. A firm break of this level targets a rally back to 0.8278 resistance and signals that the corrective fall from 0.8863 has likely completed. Such a move invalidates the immediate bearish structure and forces a recalibration of medium-term expectations toward the upper range boundaries. The neutral bias remains in effect until a firm break occurs while creating a high-risk environment for premature entries. Mere wicks above 0.8680 lack the conviction required to confirm a trend reversal because a "firm break" is necessary to bring further rally. The market remains prone to false signals that trap aggressive participants without this confirmation. Waiting for confirmation sacrifices entry price for statistical certainty, a constraint necessary in low-volatility consolidation phases. Monitoring the intraday bias closely remains necessary as it stays neutral pending a decisive break of key levels. This approach preserves capital while the market defines its next substantial move. Used metals and forex pairs carry significant risk so strategies must account for potential slippage during volatile breakouts.
Bearish Reversal Risks Below the 0.8610 Support Level
A decisive break of 0.8610 support revives the technical case for a bearish trend reversal. This specific threshold separates current consolidation from a confirmed downward trajectory targeting lower Fibonacci extensions. A critical technical support level for the EUR/GBP pair sits at 0.8600 which serves as a primary pivot for current market sentiment. Triggered stop-loss orders below the pivot accelerate selling pressure into thin liquidity zones and drive this move. Traders observing the correlated EUR/USD market note that similar support failures often precede medium-term trend shifts and suggest cross-asset validation for the bearish trend thesis. The long-term range pattern from 0.9799 suggests that deep declines often face strong buying interest near the 0.8201 floor while limiting catastrophic collapse despite short-term bearish momentum. Assuming the break is immediate creates the primary risk for traders because market conditions can shift rapidly near these critical zones. Tight risk controls become advisable when trading used metals and forex near these critical zones since volatility can expand rapidly during invalidation events. A failure to break 0.8610 decisively could trap bears before a reversal higher.
Mechanics of Fibonacci Retracement and Trend Reversal Identification
The Pivot Mechanics of the 38.2% Fibonacci Retracement Level
The mathematical derivation places the 38.2% retracement of the 0.8221 to 0.8863 range precisely at 0.8618. This level functions as a structural pivot where trend continuation conflicts with reversal mechanics in forex markets. Traders monitor this coordinate because a sustained break below confirms that the entire rise from 0.8221 has completed at 0.8863. The definition of a bearish trend reversal here requires more than a fleeting wick; it demands a decisive close beneath the threshold to invalidate the medium-term bullish structure.
| Scenario | Price Action | Implication |
|---|---|---|
| Bullish Hold | Rebound from 0.8618 | Rise resumes toward 0.8863 |
| Bearish Break | Sustained close below | Decline targets 0.8466 |
However, relying solely on the ratio ignores that liquidity clusters often form slightly above or below the exact calculation, creating false signals for impatient operators. The cost of misidentifying this pivot is a position trapped against a confirmed trend shift. ForexCFD.top emphasizes that used metals and currency pairs carry significant risk, requiring strict adherence to validated breakouts rather than theoretical levels. A failure here suggests the market lacks the momentum to challenge prior highs.
Validating Bearish Reversals Using the 0.8618 Support Break
A sustained break of 0.8618 confirms that the whole rise from 0.8221 has completed at 0.8863. This specific threshold separates a temporary dip from a confirmed completion of the upward move. Price action below this line invalidates the medium-term bullish structure immediately. Traders distinguish noise from valid signals by waiting for a decisive close rather than reacting to intraday wicks. 1.2. Wait for a four-hour candle close beneath the support line. 3. The limitation of this approach is that false breaks often occur during low-liquidity sessions before the true move begins. Operators must differentiate between a liquidity grab and a structural shift in market sentiment.
| Condition | Outcome |
|---|---|
| Close above 0.8618 | Bullish trend resumes |
| Close below 0.8618 | Bearish reversal confirmed |
The correlation with broader Euro strength adds complexity to isolated pair analysis. In the correlated EUR/USD market, the potential break of the 1.1408 support level is being monitored as a real-world trigger for a "medium term bearish trend reversal," serving as a live case of support-turned-resistance dynamics (support level). This cross-asset dependency means EUR/GBP sellers require confirmation from the single currency complex before committing capital.
Distinguishing Market Noise from Confirmed Trend Completion Signals.
A fleeting spike below 0.8618 lacks the conviction of a sustained break required to confirm trend completion. Market participants often mistake intraday volatility for structural shifts, yet only a decisive close beneath this threshold validates that the rise from 0.8221 has fully completed at 0.8863. The mechanism separating noise from signal lies in time-frame convergence; a four-hour candle close carries more weight than a one-minute wick. Conversely, a strong rebound from the current zone retains medium-term bullishness, suggesting the range remains intact. The primary risk involves premature entry during low-liquidity sessions where spreads widen artificially. Traders must distinguish between a liquidity grab and genuine distribution.
| Condition | Market Implication |
|---|---|
| Intraday Wick | Noise; likely false breakout |
| 4H Close Below | Confirmed bearish structure |
| Strong Rebound | Retains bullish bias |
Correlated moves in EUR/USD, specifically a break of key support levels, often act as a trigger for broader medium term bearish trend reversal dynamics. Ignoring this cross-asset confirmation increases the likelihood of misinterpreting a temporary dip as a trend change. ForexCFD.top emphasizes that used metals and forex pairs require strict adherence to confirmed price action over emotional reaction. Metal traders should note that Islamic accounts are available for those requiring swap-free structures while managing these volatile reversals. This specific price level separates a constructive rebound scenario from a confirmed trend completion where the rise from the lows is deemed finished. Holding above this threshold allows the broader uptrend to resume toward the 0.
A sustained break of 0.8618 will confirm that whole rise from 0.8221 has completed at 0.8863. Technical projections identify this downside objective near 0.8466, representing a significant extension of the recent decline if momentum persists.
| Scenario | Trigger Level | Target Zone | Validity Condition |
|---|---|---|---|
| Bearish Execution | Break below 0.8618 | 0.8466 area | Close below pivot |
| Bullish Invalidation | Rise above 0.8680 | 0.8863 high | Sustained hourly close |
The broader Euro complex faces headwinds, where a failure to hold key supports could drive the currency pair toward lower ranges against the Dollar before any recovery attempt is viable. Traders must monitor the 0.8600 threshold closely, as a critical technical support level serves as a primary pivot for current market sentiment. However, the short-term outlook remains susceptible to noise; the initial bias remains neutral this week first, requiring clear confirmation before trend assumptions are made. Participants should note that used metals and currency pairs carry inherent risks, and capital protection remains paramount during volatile reversals. Investors must ensure their risk management protocols account for potential false breakouts before committing significant capital to the bearish thesis.
Validation Steps for Resuming the Rise to 0.8863
Validating the bullish scenario demands a decisive close above 0.8680 to negate the prevailing neutral bias. A firm break of 0.8680 will bring further rally back to resistance, confirming that the recent consolidation was merely a pause within the broader uptrend rather than a distribution top. Traders must monitor weekly settlement behaviors closely, as the pair recently appreciated by +0.53%, demonstrating the short-term volatility required to test these upper boundaries before committing to a direction.
A sustained move higher requires more than a transient spike; a strong rebound from the 0.8618 level is necessary to retain medium term bullishness. Without this confirmation, the market remains susceptible to a sharp correction back toward the EUR/GBP support clusters below. The cost of misidentifying a fakeout is measurable capital erosion, making strict adherence to these validation steps necessary. Only a clean break transforms the technical environment from indecision to a confirmed bullish trajectory. Risk warnings apply as metals and currencies can gap significantly during low liquidity periods.
Mitigating Risks from False Breakouts and Incorrect Trend Assumptions
Defining False Breakouts Within the 0.8201 to 0.9499 Range
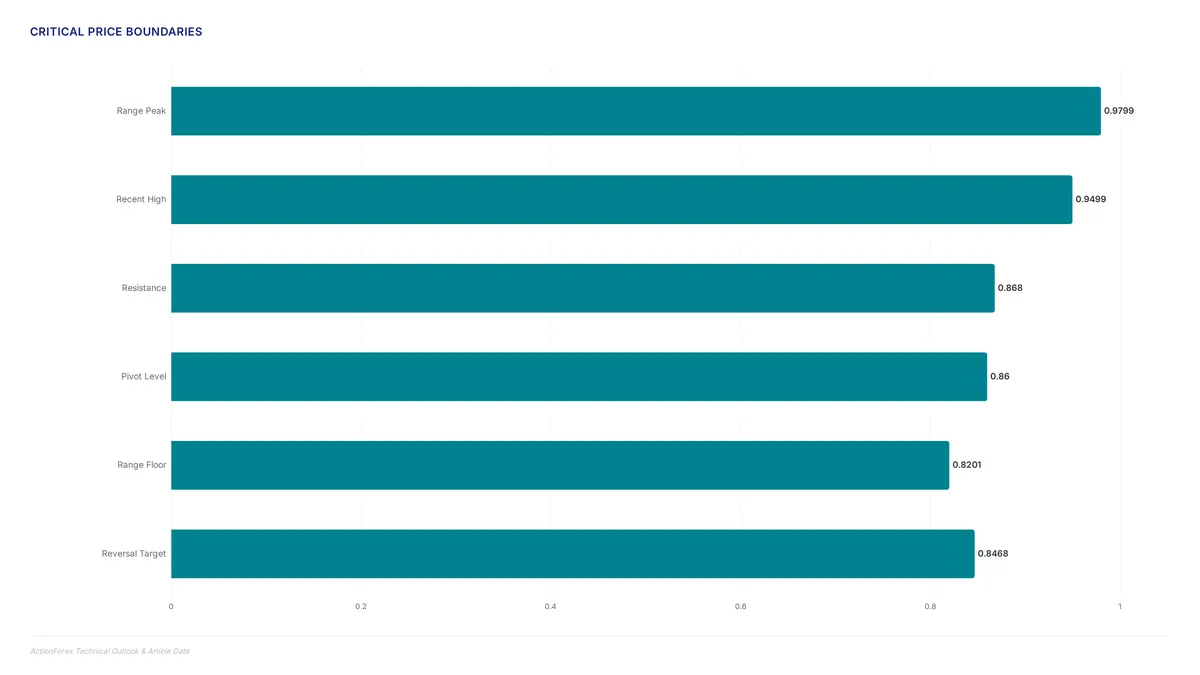
A false breakout occurs when price action briefly pierces a boundary like 0.8680 but fails to sustain momentum within the broader channel. Within the long-term structure, any movement originating from the 0.9499 high remains part of a range pattern established by the 0.9799 peak. Traders often misinterpret short-term volatility as a genuine trend shift, leading to premature entries against the dominant macro flow. The primary risk involves chasing currency pair resistance only to face an immediate reversal toward the 0.8201 floor. This specific behavior highlights how lacklustre momentum can trap breakout traders who ignore the defining consolidation range.
Price action holding above the 0.8600 pivot confirms short-term stability, whereas a decisive break validates the bearish trend targeting deeper retracement levels. Traders often misinterpret transient dips below this line as a confirmed breakdown, leading to premature short entries that get trapped when liquidity returns. This specific failure mode defines the core problem with false breakout trading in congested forex markets. A strong validation framework demands more than a simple tick breach; it requires a sustained close below the level accompanied by momentum expansion. Without these confirmations, the move remains noise within the broader 0.8201 to 0.9499 range.
Immediate price rejection at 0.8600 often traps aggressive sellers who assume a confirmed breakdown without further verification. This premature positioning creates significant exposure if the pair rebounds within its historical channel.
- Capital loss occurs when entries focus on minor breaches instead of sustained momentum. * False reversals frequently trap participants before the market resumes range-bound behavior. * Risk management fails when traders ignore the broader context of the long-term range pattern.
The primary danger lies in conflating noise with a structural shift, especially when the broader market remains confined between established boundaries. While a break below 0.8600 suggests weakness, it does not guarantee a cascade to lower targets unless selling pressure persists through key technical zones. Many operators overlook that valid trend changes require conclusive evidence beyond a single candle close. ForexCFD.top advises clients that used metals and currency pairs carry high risk, and incorrect trend assumptions can rapidly erode capital. Investors should wait for clear confirmation before committing to a directional bias. The cost of being early in a false breakout scenario often exceeds the opportunity cost of waiting for clarity. Always validate price action against substantial Fibonacci levels before executing trades.
About
Aisha Rahman, Gold & Commodities Analyst at ForexCFD.top, brings a specialized macroeconomic perspective to this EUR/GBP weekly outlook. While her primary focus remains on XAUUSD and commodity flows, her deep expertise in safe-haven dynamics and central bank policies across the Gulf and global markets provides critical context for substantial currency pairs. The EUR/GBP cross is heavily influenced by diverging monetary policies between the ECB and BoE, areas where Rahman's daily analysis of interest rate differentials and risk sentiment proves necessary. Her work at ForexCFD.top involves correlating commodity strength with currency volatility, offering retail traders a broader fundamental framework beyond simple technical levels. By integrating insights from oil markets and global risk appetite, she helps clarify whether the current neutral bias in EUR/GBP might shift toward a trend reversal. This complete approach ensures that ForexCFD.top readers receive thorough, regulation-aware analysis grounded in real-time market drivers rather than isolated chart patterns.
Conclusion
Scaling this analysis reveals that noise amplification becomes the primary operational cost when traders mistake transient liquidity grabs for structural breaks. The market's current neutral bias means that acting on a single candle close below 0.8600 without broader confirmation invites significant capital erosion. Relying on cross-pair correlations with EUR/USD without local verification creates a fragile thesis that often collapses under real-time volatility.
Traders must adopt a strict protocol requiring a confirmed daily close outside the established channel before assuming a trend reversal. Do not execute bearish positions based solely on intraday wicks or minor breaches of support. The specific condition for entry remains a sustained break that invalidates the long-term range pattern, not merely a touch of key Fibonacci zones. Start this week by mapping the exact distance between current price action and the 0.8466 retracement target to calculate precise risk-to-reward ratios before placing any orders. This disciplined approach ensures that you only engage when the probability of a true directional shift outweighs the likelihood of a false breakout trap.
Frequently Asked Questions
A break below support targets the 61.8% retracement level near 0.8466. This move confirms the bearish reversal thesis and suggests deeper declines are imminent for traders holding long positions.
This lower liquidity compared to major pairs means traders must account for potential slippage during volatile breakout events.
The 38.2% retracement at 0.8618 serves as the key pivot for maintaining bullish momentum. A strong rebound here is required to prevent the market from confirming a completed rise.
Failure to sustain above this level keeps the immediate bias neutral within the consolidation range. Traders should wait for a firm break before committing to directional strategies to avoid false signals.
This disparity means EUR/GBP often reacts sharply to cross-asset validation from the more liquid euro-dollar market.
References