Silver price holds as Fed looms
Silver dropped over 30% from pre-war levels as Fed rate hike fears reshaped the market environment.
Forget the old safe-haven narratives. Silver valuation now reacts strictly to interest rate expectations. Macroeconomic drivers like Federal Reserve policy override geopolitical tensions in modern pricing models. The 200-day SMA provides critical support while the 100-day SMA caps upside momentum. This is a strategic application of signals to identify valid entry points without speculative noise.
Current market data shows XAG/USD struggling near $70.00 despite a weaker US Dollar and falling Oil prices following the US-Iran framework agreement. FXStreet reports that the asset remains below the 100-day Simple Moving Average at $78.54, creating a bearish near-term bias even as the Relative Strength Index stabilizes. Inflation concerns may ease, but monetary policy uncertainty persists. Buyers must force a daily close above resistance, or the market surrenders to the next support zone.
The Role of Macroeconomic Drivers in Modern Silver Valuation
Defining Silver's Dual Nature as Industrial and Monetary Asset
Silver is a yieldless asset sensitive to rate shifts that also serves as a critical input for electronics. Its electric conductivity exceeds copper or gold, meaning industrial demand often competes with monetary flows. This duality explains why the white metal reacts differently to Federal Reserve signals compared to pure safe havens like gold. Rising interest rate expectations increase the opportunity cost of holding non-yielding positions, frequently suppressing prices despite geopolitical tensions. Conversely, lower rates generally support valuation by reducing this holding cost. Unlike gold, which traders primarily view as a currency hedge, silver faces headwinds when manufacturing slows or when rate hike bets surge. Recent analysis suggests silver behaves more like a monetary policy instrument than a geopolitical hedge during periods of central bank volatility. This divergence creates a complex environment where industrial fundamentals in the US or China may not offset macro-driven selling pressure. Investors must monitor both yield curves and factory output data simultaneously. Understanding this split personality is necessary for interpreting price action correctly.
Applying Fed Rate Expectations to XAG/USD Price Forecasts
Strong employment data now triggers immediate price reversals in XAG/USD. A single data point can invalidate months of bullish trends, as seen when recent US jobs figures erased year-to-date gains. Strong economic reports reduce the probability of rate cuts, increasing the opportunity cost of holding yieldless assets. The cost is measurable volatility; prices previously sank approximately a notable amount in one session amid similar hike fears. Unlike pure safe-haven narratives, the white metal now reacts sharply to inflation signals derived from energy markets. Following the announcement of the US-Iran agreement, buyers have gradually returned to the market as falling Oil prices ease inflation concerns.
Traders risking capital on geopolitical instability must recognize that silver currently fails to act as a traditional safe haven during conflict. Since the war began, the white metal has traded more like an interest rate-sensitive asset than a defensive store of value. This divergence creates a dangerous trap for investors fixated on silver vs gold correlations, as rising oil prices often trigger inflation fears that suppress precious metal valuations. Data confirms this sentiment pushed XAG/USD down more than 30% from pre-war levels despite escalating tensions. The primary risk involves misreading USD vs oil prices dynamics; higher energy costs frequently force hawkish Federal Reserve positioning, which hurts yieldless assets regardless of war narratives.
The MACD histogram displays fading red bars, a technical configuration indicating that bearish momentum is beginning to weaken even while the primary signal line stays in negative territory. The Moving Average Convergence Divergence (MACD) remains in negative territory, but the fading red histogram indicates bearish momentum is beginning to weaken. This suggests early signs of stabilization, though the MACD remains in negative territory. Traders appear reluctant to chase prices higher, with the Federal Reserve's monetary policy announcement likely to act as the next substantial catalyst in determining whether Silver can extend its recovery.
A significant risk involves misidentifying a temporary pause in selling as a full trend reversal. If the broader market structure remains bearish, the current stabilization may simply reflect a pause before the next directional move. Forecasts note that geopolitical tensions and Fed policy continue to drive sharp price movements, potentially overriding technical stabilizers. A failure to hold current levels could trigger a break toward the support level at $56.50, confirming continued downside pressure. Investors should consult regulated resources for products suited to navigating these volatile conditions. This risk is heightened as market participants hesitate to place large directional bets ahead of the Federal Reserve's monetary policy announcement.
Strategic Application of Technical and Fundamental Signals for Entry
Defining the 200-Day SMA as the Critical Entry Threshold
Silver (XAG/USD) trades virtually unchanged around $70.00 after reclaiming its 200-day Simple Moving Average, establishing this level as a key technical reference point. The 200-day metric often serves as the dividing line between long-term bullish and bearish markets. Clinging to this threshold suggests a precarious balance where a breakdown could trigger significant selling pressure as the metal tests its long-term trend direction against macroeconomic headwinds. Price action here is not merely a bounce but a test of structural integrity against the broader trend. The lagging nature of this moving average creates a constraint; it confirms trend direction but does not predict the magnitude of the subsequent move without volume confirmation. Market analysis indicates that price action compressing between the supportive 200-day and the capping 100-day SMA reflects a softened broader trend. A daily close above that level would be required to ease the current bearish bias and open the door for a move toward the next resistance area near $90.00. Strategic patience remains necessary when price action compresses between these two converging averages.
Application: Executing Trades on RSI Recovery and MACD Histogram Fading
Sellers lose grip as the Relative Strength Index recovers to 45.49, yet this statistic alone fails to confirm a bullish reversal without momentum alignment. The MACD red histogram fading in negative territory signals weakening bearish force, indicating that bearish momentum is beginning to weaken while the indicator remains in negative territory. This convergence suggests the market is stabilizing, though potential downside risks remain if the 200-day SMA fails to provide support. However, the cost of holding positions remains elevated due to opportunity costs associated with rising rate expectations, as non-yielding assets face headwinds when the Federal Reserve signals tighter policy.
Execution Framework for Trading Silver Around Critical Moving Averages
Defining the 200-Day SMA Reclaim as a Buy Signal Trigger
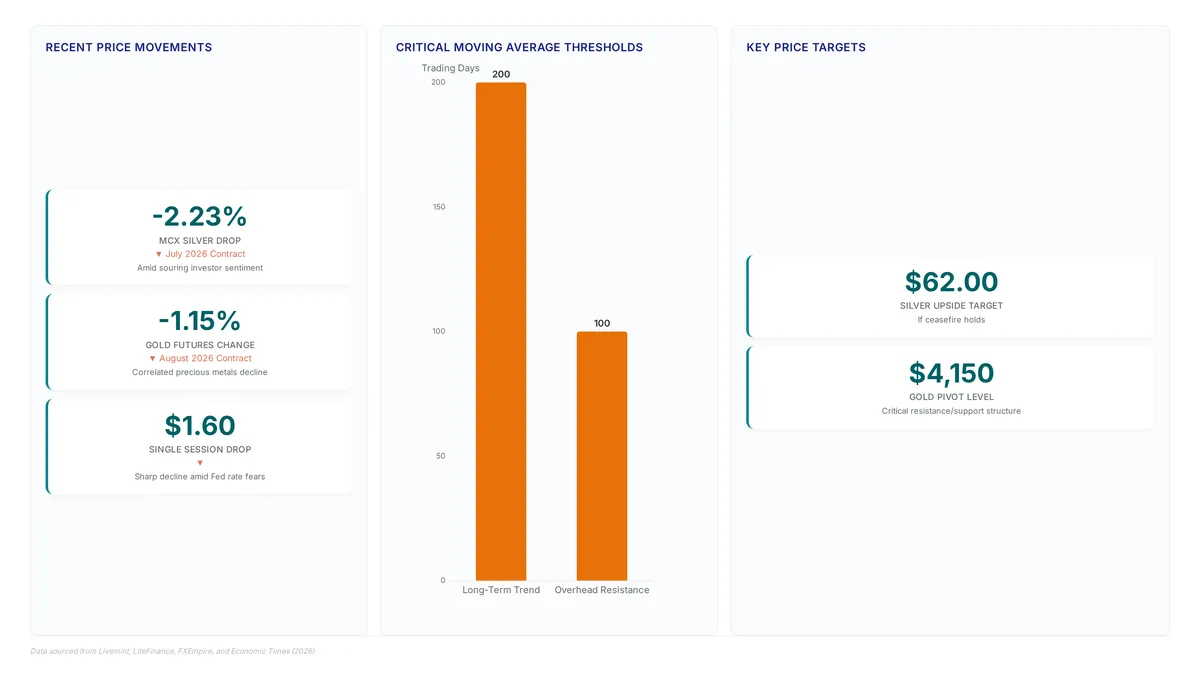
Traders interpret a reclaim when XAG/USD closes above the 200-day Simple Moving Average, shifting the technical bias from negative to neutral. The price action reflects a market where buyers have gradually returned, yet the broader trend remains capped by the 100-day SMA overhead. Clinging to this long-term average suggests a precarious balance where algorithmic selling could resurface if support fails.
- Monitor the daily close to confirm the price holds above the threshold rather than intraday spikes.
- Validate the breakout using the RSI reading, which signals easing selling pressure but lacks full bullish momentum.
- Observe price reaction near the 200-day SMA, noting that a sustained break below could expose the next substantial support zone.
The limitation of this setup is that a failure to hold the key level exposes the market to a deeper correction.
Implementation: Executing Trades on RSI Recovery and MACD Histogram Fading
Monitor the Relative Strength Index recovery, confirming that immediate selling pressure is subsiding. This specific threshold suggests the asset is exiting near-oversold territory without yet triggering overbought conditions. Traders must correlate this recovery with the Moving Average Convergence Divergence histogram, where fading red bars indicate that bearish momentum is weakening despite remaining in negative territory.
- Validate that the price action holds above the critical support zone, as breaking below could expose the market to a decline.
- Monitor the histogram for a distinct reduction in red intensity, signaling that the dominant downward trend driven by hawkish Federal Reserve expectations is losing steam.
- Note that the 200-day Simple Moving Average offers tentative medium-term support, though the near-term bias remains bearish while price sits below the 100-day SMA.
Implementation: Navigating Fed Policy Risks and Oil Price Correlations
Watch for price action to sustain above the 200-day SMA, keeping in mind that the Federal Reserve's monetary policy announcement acts as the next substantial catalyst. This technical trigger faces uncertainty if Federal Reserve officials signal aggressive rate hikes, as hawkish expectations recently drove a sharp decline in a single session. Geopolitical de-escalation can abruptly impact setups; oil prices came under pressure after the United States and Iran reached a framework agreement over the weekend, removing some of the inflation premium that supports precious metals.
- Verify that the RSI continues its recovery from near-oversold levels to confirm momentum is stabilizing. 2.3. Remain cautious if the Federal Reserve hints at restrictive policies that strengthen the dollar, as silver has traded more like an interest rate-sensitive asset than a traditional safe haven.
The primary risk lies in the conflict between technical reclaim signals and fundamental headwinds. While the chart suggests support, the macro environment may force a breakdown despite a valid moving average crossover. A daily close above the overhead resistance would be required to ease the bearish bias and open the door for higher targets. Traders are advised to prioritize risk management over signal frequency during such conflicting macro events.
About
Vikram Nair, Emerging Markets & Asia FX Writer at ForexCFD.top, brings critical perspective to the current Silver (XAG/USD) standoff near the 200-day SMA. While his daily coverage focuses on emerging-market currency pairs and central bank policies in Asia and Africa, this macroeconomic expertise is vital for interpreting how Federal Reserve decisions ripple through global commodity markets. As Silver increasingly trades on interest rate sensitivity rather than safe-haven demand, understanding the interplay between US monetary policy and the US Dollar is necessary for retail traders worldwide. At ForexCFD.top, an independent publication dedicated to forex and CFD analysis, Vikram applies his rigorous approach to macro-to-FX translation to decode these complex market dynamics. His work ensures that traders in Tier-2 and Tier-3 markets receive clear, regulation-aware insights on how substantial events, like the upcoming Fed announcement, impact asset classes beyond their local currency pairs, supporting informed decision-making without hype.
Conclusion
Silver traders face a definitive operational test where technical support clashes with macroeconomic headwinds. The market currently traps participants between a fragile floor and a rigid ceiling, creating a scenario where false breakouts become the primary cost of doing business. While the chart suggests stability, the real danger lies in complacency regarding Federal Reserve rhetoric, which can instantly invalidate technical setups. Holding a position through this volatility requires strict adherence to set boundaries rather than hope for geopolitical shifts.
Treat the current range as a high-risk consolidation zone until price action decisively clears the 100-day SMA or fails below the 200-day threshold. Do not assume a bullish reversal based solely on oversold conditions while hawkish expectations dominate sentiment. The window for speculative entries without tight stops has closed.
Start this week by setting hard alerts at the critical support and resistance levels to remove emotional decision-making during volatile sessions. Focus your analysis on whether the histogram shows genuine momentum loss in the downward trend before committing capital. Success in this environment depends on reacting to confirmed breaks rather than predicting them.
This volatility highlights the risk of holding positions when Federal Reserve expectations shift rapidly, potentially erasing gains quicker than geopolitical tensions can restore them in the current market environment.
Q: Why did silver fall 30% despite ongoing geopolitical conflicts?
A: Silver dropped over 30% from pre-war levels because it reacted to rate hikes rather than safe-haven demand. Investors must recognize that interest rate sensitivity currently overrides traditional defensive attributes during periods of central bank policy uncertainty.
Q: What price level acts as the decisive technical anchor for trends?
A: The 200-day Simple Moving Average near $68.74 acts as the decisive technical anchor.
Frequently Asked Questions
A break below support exposes the market to further declines toward $60.00. Traders should watch the $68.74 floor closely because losing it confirms the bearish bias seen in recent price action.
The 100-day SMA caps upside momentum near $78.54. Breaking this level is required to ease the bearish bias and open a path toward the next target of $90.00, according to current technical analysis.
This volatility highlights the risk of holding positions when Federal Reserve expectations shift rapidly, potentially erasing gains faster than geopolitical tensions can restore them in the current market landscape.
Silver dropped over 30% from pre-war levels because it reacted to rate hikes rather than safe-haven demand. Investors must recognize that interest rate sensitivity currently overrides traditional defensive attributes during periods of central bank policy uncertainty.
The 200-day Simple Moving Average near $68.74 acts as the decisive technical anchor.
References