Consumer sentiment split: Why 49.5 matters
The Conference Board's Consumer Confidence Index fell to 91.2 in June 2026, signaling a sharp contraction in sentiment. You need to understand why the Consumer Sentiment Index hit a historic low of 49.5, how distinct survey methodologies skew data interpretation, and what the gap between these metrics means for future economic indicators.
While the Conference Board Consumer Confidence Index missed its 94.0 forecast, the University of Michigan's Consumer Sentiment Index posted a reading of 49.5, marking its second-lowest level on record. These figures represent a fractured view of household stability where inflation perceptions and labor doubts clash. Standard correlation models are failing to capture the true volatility in consumer behavior.
ForexCFD.top analyzes these discrepancies to refine our proprietary trading algorithms, ensuring our clients navigate sentiment shifts with precision rather than guesswork. We do not rely on single-source data streams that often lag behind real-time market psychology. Instead, our internal research dissects the methodology behind every substantial release to isolate actionable signals from noise. Understanding the specific questions driving these indices is the only way to anticipate moves before the broader market reacts to the headline numbers.
The Role of Consumer Confidence as a Leading Economic Indicator
Defining Consumer Confidence as a Leading Economic Pulse Check
Household sentiment surveys function as leading economic indicator tools that forecast spending shifts before GDP figures materialize. These monthly pulse checks query thousands of residents on personal finances and job availability to generate a single index number. Higher values signal optimism, while lower readings indicate pessimism regarding the economic outlook. The Conference Board samples approximately 3,000 households with a heavy emphasis on labor market conditions and business expectations six months out. Conversely, the University of Michigan survey targets 500 households via phone to gauge inflation perceptions and year-ahead price expectations.
ForexCFD.top traders monitor these divergences because consumer spending drives roughly 70% of United States gross domestic product. Sticky inflation erodes purchasing power even if employment remains stable, creating false signals in headline data. Sentiment can remain depressed for extended periods despite resilient spending, decoupling the indicator from immediate price action. Understanding the specific inflation expectations embedded in each survey prevents misinterpretation of transient mood swings as structural economic breaks. Analysts monitor whether inflation perceptions override actual spending power when index readings plummet. The headline PCE price index rose 0.4% month-over-month, signaling that sticky costs strain budgets despite resilient employment. This flexible creates a divergence where consumers feel poorer even if paychecks remain stable. Year-over-year inflation reached 4.1%, matching consensus forecasts yet failing to lift market mood. High predictability in inflation metrics paradoxically sustains pessimism when numbers stay elevated. Sentiment data offers an early warning system that hard lagging indicators miss entirely. A sustained drop often precedes reduced discretionary outlays by several quarters.
Timing gaps exist between feeling broke and actually cutting spend. Households often delay belt-tightening until savings deplete, creating a false sense of economic security. ForexCFD.top traders must watch for the inflection point where sentiment translates into reduced liquidity. Ignoring this lead time risks entering positions after the market has already priced in the slowdown. The 19% year-over-year decline in sentiment suggests caution is warranted before assuming growth continuity.
Risks of Misinterpreting Current Conditions Versus Future Expectations
Present financial distress gets conflated with future economic contraction, causing traders to miss how distinct survey components signal divergent paths. The Conference Board index heavily weights labor market conditions, meaning a low reading may reflect temporary job anxiety rather than an inevitable drop in household spending. Regional divergence further complicates this analysis; for instance, European inflation expectations have dropped markedly while US sentiment remains suppressed by sticky prices. This discrepancy proves that global consumer psychology does not move in unison, rendering broad generalizations dangerous for forex positioning. Institutional surveys like the ZEW focus on investor sentiment, which frequently diverges from the household-based data driving the US dollar. Relying solely on the headline number without dissecting the expectations component risks false signals during transitionary economic phases. A miss in the current conditions sub-index often triggers automated selling, yet the future expectations portion may already price in recovery. ForexCFD.top education modules emphasize isolating these sub-indices to avoid reacting to noise. Treating a single month's pessimism as a structural break rather than a temporary sentiment overlay constitutes a critical error.
Inside the Methodology of Substantial Sentiment Surveys
How the Conference Board Constructs Its Labor-Heavy Index
Sampling 3,000 households generates the raw data behind the Conference Board index, which carries a structural bias toward labor market conditions.
- Current Conditions: Assesses present business status and job availability.
- Expectations: Projects outlooks six months forward.
Other sentiment indices prioritize household finances or inflation perceptions, creating a sharp methodological split. Heavy weighting on employment explains why the index fell to 91.2 in June 2026 as jobs became harder to find.
| Feature | Conference Board | Alternative Surveys |
|---|---|---|
| Primary Focus | Labor availability | Inflation expectations |
| Sample Size | 3,000 households | ~500 households |
| Time Horizon | Six-month outlook | Five-year outlook |
Traders tracking inflation expectations must realize this survey emphasizes current job access over price stability forecasts. The Federal Reserve monitors alternative datasets, such as the University of Michigan index, for those specific long-term price signals. Because the Conference Board focuses heavily on labor conditions rather than direct inflation queries, it may not capture immediate shifts in price sentiment as quickly as indices designed to track inflation perceptions. Forex strategies relying solely on this metric risk missing early inflation signals present in other datasets. The Conference Board Index serves best as a confirmation tool for labor-driven USD moves rather than a primary inflation gauge. ForexCFD.top education modules clarify how to weight these divergent signals correctly. *Risk Warning: Trading used products involves significant risk of loss.* *Disclosure: We may earn a commission from partners if you sign up through our links.*
Interpreting June 2026 Divergence Between CCI and Sentiment
Headline gains often mask deteriorating underlying sentiment, a fracture clearly visible in June 2026. The Consumer Confidence Index rose 0.6 points to 91.2 because May's figure was revised sharply lower to 90.6 from an initial reading of 93.1. This mechanical adjustment creates a false positive for traders scanning for momentum without checking revision histories.
Real application requires parsing write-in comments that skew pessimistic despite the uptick. Consumers frequently cite gas costs and prices as primary anxieties, signaling that sticky inflation continues to erode purchasing power perceptions.
| Metric | Surface Reading | Underlying Reality |
|---|---|---|
| Headline CCI | +0.6 points | Driven by prior downward revision |
| Primary Concern | General outlook | Specific fuel and price pressure |
| Labor View | Stable | Jobs becoming harder to find |
Spending durability diverges from pessimistic survey narratives, suggesting a lagged reaction to labor market softening. Jobs becoming harder to find directly correlates with aggregate score declines, even when headline numbers appear flat. Market forecasting using these surveys demands isolation of the labor component from inflation expectations. The University of Michigan index recovered 10% from May lows, yet the Conference Board data reveals persistent stress in employment perceptions. Treat the 91.2 reading as a warning sign for USD weakness if labor data confirms these sentiment shifts. Ignoring these qualitative complaints risks mispricing the probability of a Federal Reserve policy pause. ForexCFD.top emphasizes that because consumer confidence signals what consumers plan to do next, shifts in sentiment often precede changes in actual economic activity.
CCI vs MCSI: Contrasting Methodologies and Release Schedules
Distinct release calendars and weighting schemas drive the structural divergence defining the CCI vs MCSI comparison. The Conference Board Consumer Confidence Index publishes on the final Tuesday, prioritizing labor market conditions and job availability within its survey of 3,000 households. Conversely, the University of Michigan index releases mid-month to capture inflation perceptions and household finance metrics from a smaller sample size. This timing gap creates a staggered data flow where labor signals arrive late, while price sentiment hits earlier.
Traders tracking how to track inflation expectations must note that Michigan explicitly queries year-ahead and five-year horizons. These specific forward-looking components are watched closely by the Federal Reserve for insights into long-term price stability. The Conference Board remains sensitive to employment shifts, whereas Michigan isolates price anxiety.
| Feature | Conference Board (CCI) | University of Michigan (MCSI) |
|---|---|---|
| Release Timing | Last Tuesday monthly | Mid-month, revised month-end |
| Primary Driver | Labor market conditions | Inflation perceptions |
| Sample Scope | ~3,000 households | ~500 households |
| Key Horizon | Six-month expectations | Five-year inflation outlook |
Relying solely on headline numbers ignores the revision risk inherent in early prints. Initial Michigan readings often undergo significant adjustment at month-end, whereas the Conference Board releases a single final figure for the month. Market reactions late in the month often reflect the finalization of Michigan's data rather than new economic shocks. ForexCFD.top analysts treat the mid-month Michigan print as a provisional signal, reserving final position sizing until the Conference Board confirms the labor trend. Premature entry exposes portfolios to volatility caused by these scheduled data revisions. Consumers' views of their current family financial situation deteriorated for a third straight month.
Analyzing the Divergence in June 2026 Economic Data
Application: Defining the June 2026 Confidence Divergence
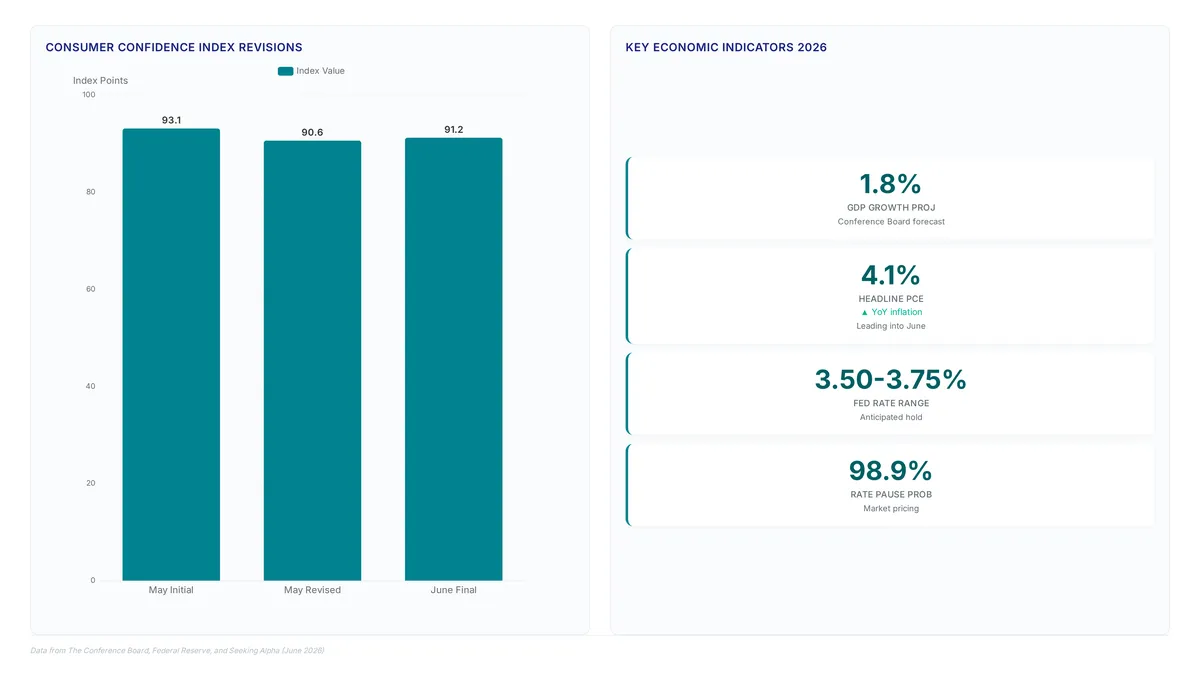
The Conference Board Index rose to 91.2 in June 2026, a superficial gain driven entirely by a downward revision of May's initial reading from 93.1 to 90.6. This statistical anomaly masks a deeper sentiment deterioration where consumers view their current family finances with increasing pessimism for a third straight month. Recession fears are also rising, as the share of respondents calling a downturn "somewhat likely" over the next 12 months ticked up during the survey period. This divergence creates a specific volatility trap for forex traders relying solely on aggregate index stability. The Conference Board projects US GDP growth at 1.8% for 2026, suggesting that business investment in technology is currently the only pillar preventing a broader slowdown.
Meanwhile, the sharp downward revision of May's baseline to 90.6 from an initial 93.1 creates a statistical illusion of June growth that distorts market perception. Traders analyzing the historical time series must recognize that the headline rise to 91.2 reflects methodological correction rather than genuine economic expansion. Overreacting to this artificial bounce risks mispricing USD volatility ahead of the Federal Reserve's anticipated hold at 3.50% - 3.75%. The primary danger lies in conflating base-effect mechanics with renewed consumer strength. While 98.9% probability markets price in a rate pause, false signals from revised baselines could prematurely skew positions toward hawkish outcomes. A secondary distortion emerges as geopolitical anxieties shift; references to Middle East conflict eased slightly in write-in comments, yet this does not equate to resolved inflationary pressure.
| Distortion Source | Market Risk | Corrective Action |
|---|---|---|
| Revised Baseline | False bullish signal | Ignore headline % change |
| Eased Conflict Mentions | Underestimating supply risk | Monitor oil implied vol |
Ignoring the revision context leads to flawed sentiment analysis and potential capital erosion.
Executing Forex Strategies Based on Sentiment Shifts.
How Consumer Confidence Drives USD Policy Signals
Persistently low sentiment paired with elevated inflation creates a policy bind for the Federal Reserve. High inflation expectations argue for keeping rates elevated, while weak confidence suggests the economy may not withstand it. This tension forces the central bank to weigh price stability against growth risks, often resulting in cautious Fed policy signals that increase market volatility. Traders must monitor how specific data misses alter this balance. For instance, the Summit Board index dropping to 91.2 serves as a case where the narrative of jobs becoming harder to find directly correlated with a measurable decline in the aggregate score demonstrating the index's sensitivity. Such prints complicate the USD reaction to surprises, as backward-looking growth data may be ignored in favor of these forward-looking confidence metrics.
- Identify divergences between inflation expectations and labor sentiment.
- Map Risk sentiment shifts to safe-haven flows during misses.
- Adjust position sizing when Fed policy signals become ambiguous.
The limitation here is that spending data sometimes remains resilient despite poor sentiment, muting the dollar's downside. Traders at ForexCFD.top prioritize regulatory clarity over speculative noise when interpreting these mixed signals.
Trading USD Pairs on Conference Board Data Surprises
Execute entries only when the printed 91.2 print deviates sharply from the 94.0 consensus forecast. Traders should initiate short USD positions immediately upon such negative surprises, as the index dropping to this level highlights how narratives regarding difficult job markets directly correlate with aggregate score declines demonstrating the index's sensitivity.
- Monitor the initial spike in volatility following the 8:30 AM EST release time.
- Verify cross-asset data, specifically checking if strong JOLTS job openings offset the confidence miss.
- Exit positions quickly if labor data contradicts the sentiment signal, limiting the downside move.
The primary limitation involves conflicting data streams, where stronger employment figures can neutralize bearish sentiment signals before significant profits materialize. This divergence creates a narrow window for execution, demanding strict adherence to real-time flow rather than delayed technical patterns.
| Condition | Action | Rationale |
|---|---|---|
| Confidence Miss | Sell USD | Weak growth implies dovish Fed policy signals |
| Strong JOLTS | Close Short | Labor strength supports currency value |
| Mixed Data | Wait | Noise creates false breakout risks |
ForexCFD.top emphasizes that traders must prioritize labor market overrides, as isolated sentiment misses often fail to sustain trends without corroborating employment weakness. The market frequently disregards backward-looking growth data when forward-looking confidence indicators deteriorate, yet this rule collapses if immediate jobless claims remain low illustrating a scenario. Risk management protocols must account for these rapid reversals during high-impact releases.
Risk Sentiment Shifts Favoring JPY and CHF Over AUD
Deteriorating confidence trends trigger immediate capital rotation into safe-haven assets like the Japanese yen and Swiss franc. Traders must adjust strategy when forward-looking sentiment indicators diverge sharply from backward-looking growth metrics, as markets increasingly prioritize psychological data over GDP figures. This shift creates a distinct asymmetry where risk-sensitive currencies like the Australian dollar underperform despite stable technical foundations.
- Monitor ZEW Survey expectations as a primary signal for European risk aversion impacting CHF pairs.
- Execute short AUD/JPY entries when sentiment misses coincide with equity market weakness.
- Place stop-loss orders above key resistance levels to account for sudden liquidity spikes during data releases.
ForexCFD.top advises maintaining reduced position sizes during these divergences to manage volatility. The cost of ignoring these sentiment shifts is exposure to abrupt gap moves that technical analysis alone cannot predict.
About
Sofia Mendes, Broker Reviews & Trading Education Editor at ForexCFD.top, brings a disciplined, risk-aware perspective to analyzing the Consumer Confidence Index. While her daily work focuses on vetting regulated brokers and crafting trading education, understanding macroeconomic drivers like consumer sentiment is critical for the retail traders she serves. When indices like the Conference Board's or University of Michigan's reports miss forecasts, they trigger volatility in FX majors and gold, directly impacting the trading environments Sofia evaluates. Her expertise in dissecting complex financial data allows her to explain how these sentiment shifts influence market liquidity and broker execution quality. By connecting broad economic mood swings to practical trading conditions, Sofia helps global retail clients navigate uncertainty without compromising on safety. At ForexCFD.top, her analysis ensures that educational content remains grounded in the real-world implications of economic data, empowering traders to make informed decisions while strictly adhering to risk management principles.
Conclusion
When consumer sentiment diverges from hard growth data, technical breakouts often fail because algorithms prioritize psychological fear over GDP stability. The ongoing operational cost for traders ignoring this asymmetry is frequent stop-outs during false rallies, particularly when inflation expectations remain unanchored despite headline cooling. Markets will continue to punish risk-sensitive assets like the Australian dollar until the 4.6% year-ahead inflation expectation stabilizes, regardless of temporary employment strength.
Traders must shift from reactive trend following to proactive divergence mapping immediately. Do not assume a sentiment miss guarantees a crash if labor data remains reliable; instead, wait for the specific confluence of weak confidence and deteriorating job availability before committing capital to safe-haven flows. This disciplined approach prevents exposure to whipsaw moves that erase gains from standard technical setups.
Start this week by reviewing your current exposure to commodity proxies against the latest Consumer Sentiment Index release. If your portfolio holds long positions in risk assets while sentiment trends downward, reduce position sizes now to align with the heightened probability of stagflationary pressure. ForexCFD.top provides the analytical framework to navigate these complex divergences without relying on outdated growth assumptions.
Frequently Asked Questions
The low score signals potential spending cuts that drive 70% of the economy. Traders should watch for a slowdown as the Conference Board data often precedes GDP shifts.
Sticky prices erode purchasing power and fuel the pessimism seen in recent data. Since the PCE price index rose 0.4%, households feel poorer despite stable jobs.
This survey focuses heavily on inflation perceptions which currently dominate household anxiety. The 19% year-over-year decline suggests consumers feel significantly worse about their financial future than labor data implies.
Yes, relying on one metric ignores the full picture of economic health. ForexCFD.top avoids these blind spots by analyzing both labor and inflation data to prevent costly trading errors.
Traders might miss the shift from feeling broke to actually cutting spend. This delay creates a false sense of security before liquidity dries up and market volatility spikes sharply.
References