Dollar index hits 101.13 as Fed stays hawkish
The US Dollar Index (DXY) hit a 13-month high of 101.13 as the Federal Reserve held rates at 3.50%-3.75% under Chair Kevin Warsh. FXStreet reports the DXY trades near 100.70 after removing previous language regarding "additional rate adjustments," signaling a pivot toward sustained hawkishness. With headline PCE rising 0.4% month-over-month in May 2026, the Federal Reserve faces limited room to ease policy, thereby strengthening the US Dollar against peers like the Euro and Yen. Investors must now navigate a environment where the Bank of Japan tightens to 1.00% while the Fed maintains a restrictive range, creating volatile spread differentials.
Readers will learn how PCE inflation metrics directly influence Fed rhetoric and subsequent Dollar valuation shifts. The analysis details the mechanics of central bank intervention when pairs like USD/JPY approach critical levels such as 161.30. Finally, the piece outlines strategies for using economic calendars to time entries around flash PMI releases and GDP data that currently dictate market sentiment.
The Role of PCE Inflation and Hawkish Fed Policy in Dollar Valuation
PCE Inflation Data and the Fed's Hawkish Stance Set
The Personal Consumption Expenditures (PCE) price index serves as the Federal Reserve's primary inflation gauge, rising 0.4% month-over-month in May 2026. This specific metric dictates monetary policy because it captures broad consumer spending patterns improved than alternative indices. A hawkish stance emerges when central bankers prioritize price stability over growth, often keeping interest rates unchanged at 3.50%-3.75% while signaling future tightening. Such rhetoric tightens financial conditions even without immediate rate hikes, forcing traders to price in higher borrowing costs sooner. The headline PCE price index rose 4.1% year-over-year, reinforcing expectations that the Fed will maintain this restrictive posture.
Assessing USD Momentum Using PCE Reports and Rate Decisions
Traders assess USD momentum by correlating sticky inflation prints with Federal Reserve rate path expectations. The US Dollar Index (DXY) trades near the 100.70 price zone on Friday, having reached a 13-month high of 101.13 earlier in the day. A hotter-than-expected PCE report reinforces this hawkish stance, driving capital flows toward yield-bearing dollar assets. Market participants monitor diverging central bank policies where the Bank of Japan maintains a tightening bias contrasting with US stability. Stronger inflation data hardens the Fed's position, suggesting a trend towards higher-for-longer interest rates which supports dollar appreciation. Singular focus on domestic US data creates vulnerability if global growth fears suddenly dominate sentiment. Forecasting requires watching how quickly markets price in rate probabilities after each release. Gold falls to a 7-month low on hawkish Fed expectations, illustrating the opportunity cost of holding non-yielding assets during these cycles. Consequently, a US dollar forecast relying solely on technical breakouts without checking the inflation calendar risks entering false moves. Traders must weigh the immediate reaction against the broader policy trajectory set by Chair Kevin Warsh.
Risks of Removing Additional Rate Adjustment References
Deleting explicit guidance on future tightening creates policy ambiguity that destabilizes currency pair valuations immediately. The Federal Reserve decided to remove its previous reference to additional rate adjustments, leaving markets without a clear forward path for the federal funds rate. This rhetorical shift forces traders to infer intent from volatile inflation data rather than relying on steady committee signals. A hotter-than-expected PCE report could reinforce the Fed's hawkish stance and extend the upward USD trend despite the muted language. Lack of clarity increases the probability of sharp corrections if economic prints miss consensus estimates. Traders monitoring diverging central bank policies face heightened execution risk as algorithms react to noise. The removal of specific adjustment references means every data point carries disproportionate weight in pricing models. Liquidity may evaporate during key release windows as market makers widen spreads to protect against sudden volatility spikes. Operators must prepare for erratic price action where standard technical levels fail to hold support. The primary danger lies in the mismatch between market expectations and the Fed's silent pivot toward data dependence. Such uncertainty demands stricter risk controls than periods with clear guidance.
Mechanics of Currency Pair Divergence and Central Bank Intervention
Defining Flash PMI Data and Its Role in EUR/USD Volatility
Flash PMI data delivers the first monthly read on private sector health, sparking price swings well before official GDP figures land. This early indicator matters because EUR/USD dropped 0.80% this week to 1.1480 as traders priced in diverging economic momentum between the Eurozone and the United States. The Eurozone calendar leans heavily on these flash releases alongside German Ifo Business Climate surveys to gauge whether manufacturing contraction is deepening or stabilizing. Market players often misread the weight of these prints, assuming every deviation moves pairs equally. German flash figures carry outsized influence, swinging the single currency more than aggregate Eurozone numbers due to Germany's export dominance.
| Data Release | Primary Impact Zone | Typical EUR/USD Reaction |
|---|---|---|
| Eurozone Flash PMI | Broad sentiment shift | Moderate volatility |
| German Flash PMI | Core industrial outlook | Sharp directional move |
| US Core PCE | Fed policy probability | Trend reinforcement |
The Swiss Franc draws sharp focus as a risk proxy during such divergences, with technical setups for USD/CHF highlighting the pair's sensitivity to policy gaps. Traders must separate noise from genuine trend shifts when these early indicators clash with lagging employment data. Flash estimates undergo revision, creating false signals for algorithmic systems programmed to react to initial headlines.
Mechanics of USD/JPY Intervention at the 161.30 Level
The 161.30 price zone acts as a calculated barrier where the Bank of Japan balances domestic tightening pressures against Federal Reserve caution. The mechanism depends on the Ministry of Finance issuing verbal warnings before committing capital, yet the volume required to reverse momentum often exceeds initial market expectations.
| Factor | Impact Mechanism | Operator Constraint |
|---|---|---|
| Yield Spread | Widening gap favors USD longs | Limits BoJ selling capacity |
| Intervention Threshold | 161.30 acts as psychological resistance | Requires surprise to trigger flow |
| Policy Divergence | Fed hold vs. BoJ hike to 1.00% | Creates volatile mean reversion |
Predicting these moves remains problematic because the Bank of Japan operates with deliberate opacity regarding its exact trigger thresholds. The cost of misinterpreting this divergence is measurable; traders assuming a hard cap without confirmed intervention often face significant drawdowns as the pair tests the 40-year high approach. The limitation for market participants lies in the asymmetry of information. Unlike the Federal Reserve, which communicates through scheduled FOMC meeting minutes and press conferences, the BoJ relies on irregular statements that offer limited forward guidance on currency specifics. This structural gap means technical levels like 161.30 serve as provisional ceilings rather than absolute boundaries. Operators must prioritize liquidity management over directional bets when price action nears these historical extremes.
Divergent Monetary Policies: BoE Rate Hold vs ECB Inflation Warnings
The 7-2 vote at the Bank of England created immediate GBP weakness, contrasting sharply with the European Central Bank's rhetorical warnings about persistent inflation risks. This divergence forces traders to monitor EUR/USD stabilization attempts as the primary gauge for Eurozone durability against a strengthening Dollar. The Fed interest rate outlook remains the dominant variable, yet regional nuances drive specific pair volatility. For instance, GBP/USD slides near 1.3230 as the narrow majority for holding rates signals caution to investors seeking yield differentials.
Relying solely on rate differentials ignores the mechanical impact of ECB monetary policy signals regarding energy transmission, which can invalidate pure carry-trade logic during supply shocks. The cost of this policy misalignment is evident in capital flows rotating toward US assets, leaving European currencies vulnerable to sudden sentiment shifts. Traders must prioritize central bank communication schedules over static economic data when positioning for USD strength against currencies. Verbal intervention from the ECB often lacks the binding power of an actual rate change, creating a false sense of support.
Strategic Application of Economic Calendars and Heat Maps for Entry Timing
Decoding Heat Map Volatility and Central Bank Speaker Calendars
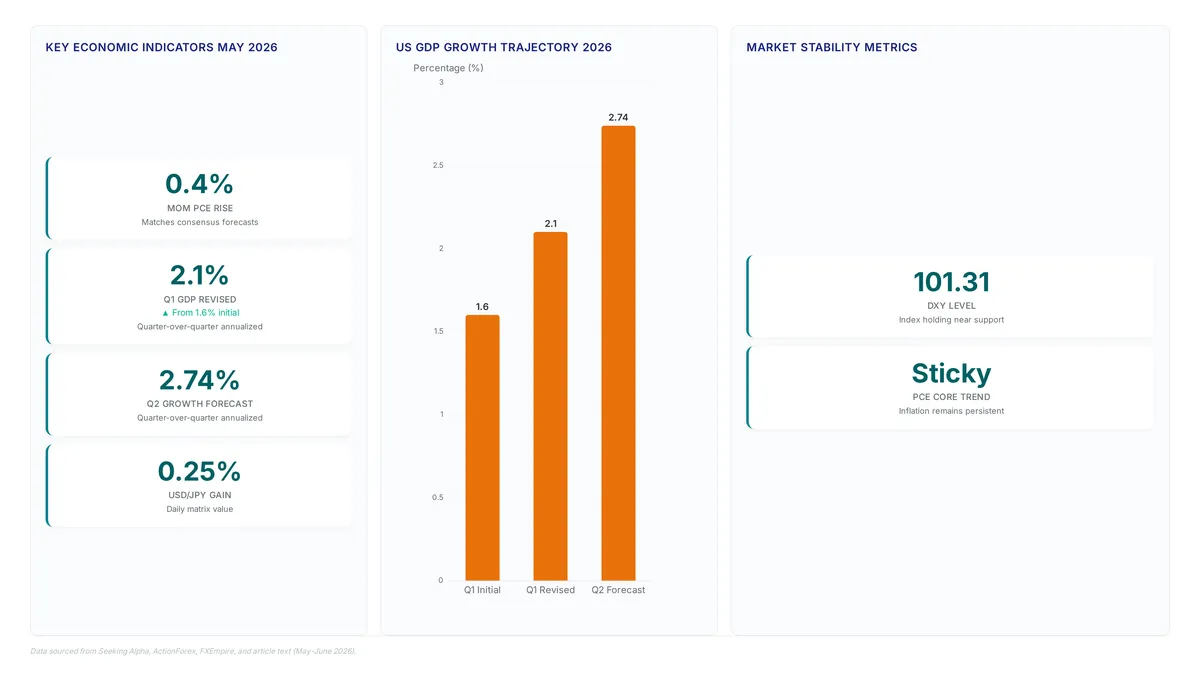
Percentage change heat maps visualize relative currency strength by displaying matrix values where the US Dollar showed a 0.25% gain against the Japanese Yen today. Traders interpret these grids by selecting a base currency from the left column to measure performance against quote currencies across the top row. Color intensity correlates directly with volatility potential, guiding entry timing for pairs like AUD/USD near support levels. Scheduled speeches by officials including ECB President Lagarde and the Fed's Waller on Monday, June 22 introduce asymmetric risk during otherwise quiet sessions. No substantial Fed, BoE, BoJ, or RBA interest rate decisions are scheduled for the week, making commentary the primary catalyst for price action. Market participants must track these timelines because unexpected hawkish rhetoric can invalidate technical setups derived from static economic calendar data alone. Speech outcomes are binary; a dovish surprise may trigger rapid reversals that heat maps cannot predict in real-time. The US Dollar Index holding near 101.31 suggests the market has priced in current fiscal deficits despite global volatility. Operators should prioritize central bank speaker calendars over routine data releases when rate decisions are absent. Liquidity provision algorithms must widen spreads during confirmed speaking slots to accommodate sudden volume spikes driven by rhetorical shifts rather than fundamental data changes.
Timing AUD/USD Entries Around RBA Governor Bullock and PCE Data
Align AUD/USD execution by sequencing RBA Governor Bullock's Saturday, June 27 speech against the May 2026 PCE inflation print. This specific data point often hardens the Federal Reserve's position toward higher-for-longer rates, directly supporting dollar appreciation against commodity currencies. Trading USD before such high-impact data releases carries asymmetric risk due to potential volatility spikes. The strategic workflow involves four distinct phases. First, monitor the economic calendar for the PCE data release time to establish the baseline USD momentum. Second, correlate this with the scheduled commentary from RBA Governor Bullock, looking for divergences in tone regarding domestic inflation transmission.
Navigating EUR/USD Declines and BoE Vote Splits During Data Releases
Traders must avoid opening USD positions before PCE data because algorithmic responses create unmanageable slippage during volatility catalyst windows. The recent EUR/USD drop to 1.1480 illustrates how quickly divergent central bank signals invalidate technical entry points. Such internal disagreement introduces uncertainty that standard economic calendars often fail to quantify effectively.
| Event | Risk Profile | Technical Consequence |
|---|---|---|
| PCE Release | Extreme | Breach of support/resistance |
| BoE Split Vote | High | False breakout patterns |
| Speech Calendar | Medium | Liquidity evaporation |
Operators analyzing the economic calendar should note that scheduled speeches by Lagarde or Waller can override static data interpretations. Liquidity providers widen spreads precisely when technical setups appear most strong. FXStreet analysis identifies mid-June as a critical period where inflation data triggers manual and algorithmic responses ahead of FOMC decisions. Volatility catalyst windows demand reduced position sizing rather than aggressive entry timing. Traders asking whether to trade USD before PCE releases should recognize that the cost of being wrong exceeds the potential reward of early positioning.
Commodity Price Sensitivity to Interest Rate Expectations and Geopolitics
Defining Gold Price Sensitivity to Rate Expectations

Gold (XAU/USD) struggles near the $4,155 level as rising rate expectations increase the opportunity cost of holding non-yielding assets. This inverse correlation intensifies when inflation metrics like the PCE Index signal persistent price pressures, forcing traders to price in tighter monetary policy. Such conditions triggered a break below the $4,000 psychological level, marking a seven-month low driven by fundamental shifts. Geopolitical tension often supports precious metals, yet interest rate differentials dominate current portfolio decisions. The table below contrasts asset drivers under current market regimes.
| Driver | Impact on Gold | Impact on USD |
|---|---|---|
| Hawkish Fed Stance | Negative | Positive |
| Geopolitical Risk | Positive | Mixed |
| Real Yield Rise | Negative | Positive |
Middle East uncertainty may limit downside volatility. Real yields exert a stronger gravitational pull when central banks signal hiking cycles. Peace developments, such as the US-Iran agreement affecting oil near $76.50, ease inflation fears and remove a key support pillar for gold prices. Traders must prioritize monitoring inflation releases over headlines because sticky data reinforces the dollar while suppressing metallic valuations. Any failure to hold technical supports invites further liquidation until policy clarity emerges. This diplomatic advance reduced immediate supply disruption fears, allowing prices to retreat from recent highs. Concerns over the Middle East potentially limit downside for the precious metal, creating a divergent path for energy and bullion markets. Specific conflict resolutions impact different asset classes simultaneously.
| Asset Class | Primary Driver | Current Constraint | Market Implication |
|---|---|---|---|
| Crude Oil | Supply Normalization | Diplomatic Fragility | Bearish pressure persists while flows normalize |
| Gold | Safe Haven Demand | Rate Sensitivity | Floors remain intact despite dollar strength |
| USD Index | Fed Policy Stance | Data Dependence | Volatility clusters around PCE releases |
The geopolitical risk premium embedded in gold prices reflects a market pricing in potential escalation rather than de-escalation. Oil reacts sharply to immediate flow assurances. Gold maintains a bid due to lingering regional instability that diplomatic papers alone cannot erase. Real yield calculations matter less than the persistent fear of sudden kinetic events in this environment. Even with peace talks, structural tension keeps a floor under XAU/USD valuations. Regulatory frameworks in substantial economies often mandate higher capital reserves for banks holding conflict-zone assets, indirectly supporting safe-haven flows into regulated bullion markets. Oil may slide on news headlines. Gold refuses to break key technical supports. Energy markets price the present peace. Precious metals price the next potential war. Traders should monitor whether oil's decline eases broader inflation fears enough to offset gold's geopolitical support.
Oil Supply Normalization vs Fiat Currency Inflation Dynamics
Lower energy prices directly ease inflation fears by reducing the headline PCE input costs that drive central bank expectations. Crude flows normalize following diplomatic breakthroughs. The resulting pressure on consumer prices allows policymakers to maintain a hawkish stance without triggering immediate recessionary signals. This flexible contrasts sharply with fiat currency fluctuations driven by divergent monetary policies, where valuation shifts reflect interest rate differentials rather than physical supply constraints.
| Factor | Oil Supply Shock | Fiat Inflation Driver |
|---|---|---|
| Primary Mechanism | Physical flow disruption | Monetary base expansion |
| Policy Response | Strategic release | Interest rate hike |
| Duration | Transient spike | Persistent trend |
| Trader Focus | Inventory levels | Employment data |
Gold prices react to this tension by weighing geopolitical risk premiums against the opportunity cost of holding non-yielding assets. Energy normalization removes a key inflationary pillar. Sticky core metrics often keep real yields elevated, capping precious metal rallies despite currency debasement fears. Oil-driven disinflation may arrive too slowly to offset the immediate impact of rate hikes on liquidity. The divergent central bank policies create a complex environment where commodity supply relief does not automatically translate into currency strength if the Federal Reserve remains data-dependent. Markets must distinguish between temporary supply fixes and structural monetary shifts to avoid false breakouts.
About
Sofia Mendes serves as the Broker Reviews & Trading Education Editor at ForexCFD.top, where she oversees the platform's rigorous broker due diligence and educational resources. While her primary focus lies in evaluating regulatory compliance and trading conditions, this role demands a deep, practical understanding of macroeconomic drivers like the US Dollar Index (DXY). As retail traders in emerging markets navigate volatility surrounding Federal Reserve decisions and PCE data, Mendes' expertise ensures that market analysis is paired with necessary context on execution quality and risk management. Her daily work comparing FCA, ASIC, and DFSA-regulated brokers directly connects to how currency fluctuations impact trading costs and margin requirements. By grounding complex forex forecasts in consumer-protective standards, she helps traders interpret DXY momentum through the lens of safe trading practices. This approach aligns perfectly with ForexCFD.top's mission to provide vendor-neutral, regulation-aware analysis for a global audience seeking clarity amid central bank uncertainty.
Conclusion
Volatility spikes when traders mistake temporary oil-driven disinflation for a structural shift in monetary policy. This divergence between falling energy costs and sticky core inflation means the dollar will likely remain strong until employment data forces a genuine pivot. Relying on commodity price drops to soften the Fed's stance is a strategic error that ignores the central bank's primary mandate.
Traders must lock in exchange rates before the next decision on 29 July 2026 to avoid being caught by sudden liquidity shifts. The window to hedge USD exposure without paying a premium for uncertainty is closing as the market prices in further hikes. Do not wait for the headline PCE to confirm the trend, as price action often leads the data by weeks.
Start by fixing the rate on any upcoming USD payments this week rather than speculating on a reversal. This immediate action removes the single most consequential unknown facing your portfolio before the summer decision window opens. Protecting capital against policy divergence requires acting before the broader market adjusts to the new reality of sustained high yields.
Frequently Asked Questions
Sticky inflation forces the Fed to keep rates between 3.50% and 3.75%. The 0.4% monthly rise in PCE confirms persistent pressure, limiting any chance for policy easing soon.
Divergent policies drive gains as the BoJ hikes to 1.00% while the Fed holds steady. This spread creates volatility, pushing the dollar higher against the yen today.
Hawkish Fed expectations cause gold to fall toward the $4,155 level quickly. Investors flee non-yielding assets when rate hikes appear likely, reducing demand for precious metals immediately.
The Euro declined 0.80% this week as traders priced in sustained US strength. This drop reflects the market adjusting to divergent central bank mandates and sticky inflation data.
Oil trades near $76.50 per barrel as peace deals reduce supply fears. Lower energy costs may ease inflation concerns, potentially influencing future central bank rate decisions globally.
References
- USD Forecast 2026: Dollar Outlook for the Next 6
- Gold falls to seven-month low below $4,000 on rising
- US Dollar Price Forecast: Dollar Strengthens on Fiscal and
- Gold Price Outlook June 2026: What CPI and the
- The headline PCE price index rose 0.4% on a
- Sunrise Market Commentary - ActionForex: US Q1 GDP was