Economic Calendar: July 6-10 Inflation Risks
The July 6-10, 2026 economic calendar centers on a single tension: can the US ISM Services PMI hold at 54.2, or does sticky inflation finally crack the labor market? This week's data releases force central banks to choose between pivoting from restrictive policies or keeping rates higher for longer. Asset prices will react to how sticky inflation metrics collide with slowing employment numbers.
Raw data points like the Eurozone PPI M/M figure of 0.20% matter less than the gap between consensus estimates and actual prints. ActionForex data shows Eurozone Sentix Investor Confidence improving to -8.9 from -13.4, hinting at a sentiment shift despite mixed manufacturing outputs. Decoding these consensus forecasts requires understanding the mechanics of global data releases across time zones.
A strategic framework for integrating macroeconomic data must focus on high-impact events like the FOMC Minutes and RBNZ Interest Rate Decision. Specific volatility triggers, such as the USD Trade Balance missing expectations by a wide margin last month, define the trading landscape. By tracking these global indicators, traders can ignore daily noise and focus on structural economic trends.
Core Economic Indicators Defining the July 6-10 Market Environment
Defining Services PMI and the 50-Point Expansion Threshold
Readings above 50 signal sector expansion while figures below denote contraction for the Services Purchasing Managers' Index. This standardized threshold removes ambiguity for traders interpreting global PMI data by converting complex survey responses into a single actionable metric. Unlike trade balance figures that measure net flow volumes, this diffusion index captures the direction of change across purchasing managers in the service sector. Market participants monitor this gauge closely because the service sector often drives employment and inflation trends more than manufacturing in developed economies. A reading hovering near the midpoint suggests stagnation. A decisive move past the benchmark triggers algorithmic rebalancing across equity and currency pairs.
Applying CPI YoY and PPI M/M Metrics to July 6-10 Market Analysis
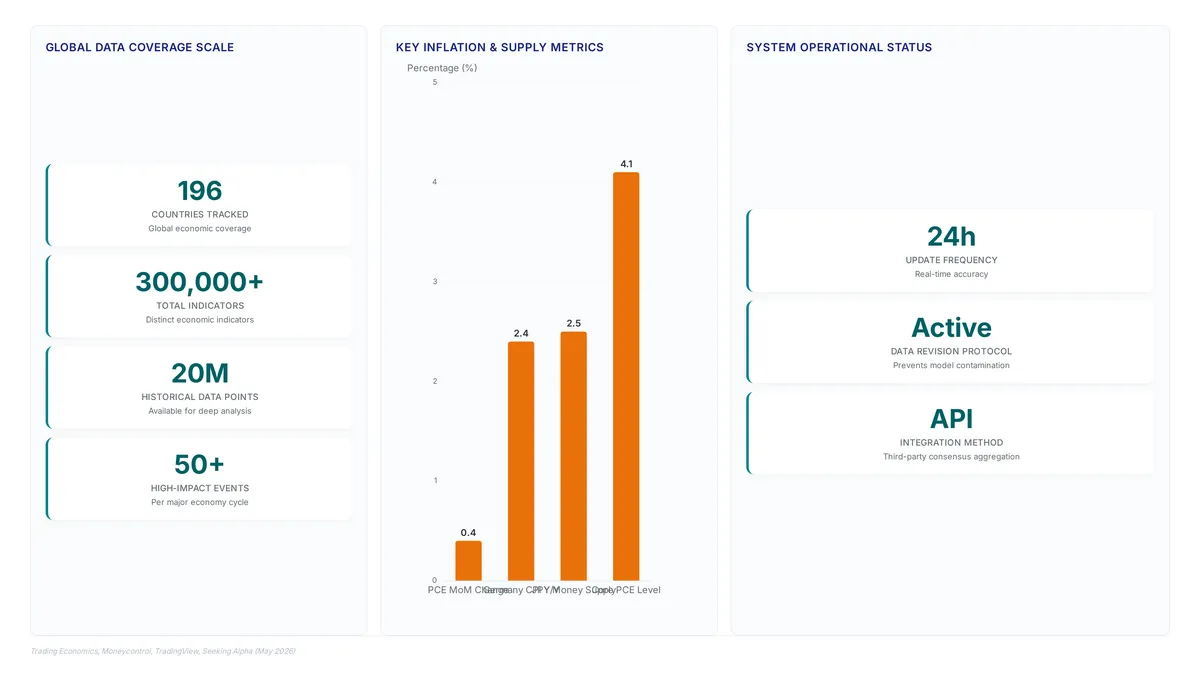
CPI YoY measures the annual change in consumer prices to reveal long-term inflation trends. Traders compare this against the headline PCE price index which rose 4.1% year-over-year in May 2026. A divergence between these two metrics often signals shifting consumer purchasing power before it impacts central bank policy. Backward-looking data cannot predict sudden supply shocks affecting the current week. PPI M/M indicates short-term wholesale price pressure flowing through production chains. Japan's upcoming reading faces a prior high of 0.90%, creating a volatile setup for JPY pairs if the new figure deviates. This metric serves as an early warning system for future CPI YoY spikes. Wholesale volatility does not always transmit fully to end consumers due to margin compression. Understanding trade balance economic impact requires analyzing how price changes alter export competitiveness. A widening deficit alongside rising producer prices suggests stagflationary risks for the currency. Markets often overlook that sustained input cost increases eventually force employment reductions to preserve liquidity. ActionForex highlights these divergences in their July 6-10 summary to guide positional adjustments. Operators must weigh immediate price data against broader structural shifts in trade flows.
Services PMI Versus ISM Services Employment Index: Distinct Labor Signals
The Services PMI measures broad sector activity while the ISM Services Employment Index isolates hiring sentiment within that same sphere. A reading above 50 signals expansion yet the employment sub-index recently printed 47.9, indicating contraction despite overall growth. This divergence suggests operators are meeting demand through efficiency gains rather than new hires, a nuance lost on headline watchers. Data platforms tracking 20 million indicators allow traders to spot these specific labor cracks instantly. Traders must distinguish between these outputs because broad activity does not guarantee wage pressure. Employment data often lags actual firing or hiring cycles by weeks. Relying solely on the headline number risks misjudging the Federal Reserve's next move on interest rates. Technical implementations now mark such historical revisions with an asterisk to denote updated values. ActionForex highlights this specific employment disconnect as a critical watch point for the July 6-10 window. Ignoring the internal components of the report leaves portfolios exposed to sudden volatility shifts.
Mechanics of Global Data Releases and Consensus Forecasting Models
Consensus Forecasting Mechanics and Previous Value Tagging
Consensus figures represent aggregated third-party forecasts, whereas previous values reflect finalized official releases from national statistics bureaus. Platforms technically integrate these disparate streams, merging Bloomberg survey data with government outputs to create a unified display for traders monitoring us jobless claims previous vs consensus differentials. This aggregation requires strong API-level handling to ensure the consensus estimate aligns temporally with the previous release it predicts. Without such integration, comparing a forecast against an outdated baseline would yield invalid signals for portfolio positioning. Data revision protocols manage discrepancies between initial prints and updated official records.
The critical limitation lies in the latency of revision tagging; while actuals update instantly, the historical data correction often lags, creating a temporary window where backtested performance metrics appear artificially inflated. Traders relying on uncorrected previous values for volatile indicators like PPI M/M may misinterpret trend momentum until the asterisked update propagates through the feed.
Tracking Global Release Cycles Across Time Zones
In practice, the 24-hour update cycle ensures economic calendars reflect near real-time accuracy for global participants. Monitoring begins early with the AUD TD-MI Inflation Gauge, where the June reading follows a previous decline of 0.30%. Traders must distinguish between distinct German metrics; factory orders target demand while industrial production measures output volume. These separate releases often trigger divergent EUR volatility despite sharing a common manufacturing narrative.
| Metric Type | Focus Area | Previous Value Context |
|---|---|---|
| Factory Orders | New Demand | Rebound from -3.80% contraction |
| Industrial Production | Physical Output | Stagnant at 0.40% growth |
| Trade Balance | Net Exports | USD deficit widening past -105.8B |
Later in the session, attention shifts to the USD Goods Trade Balance for May, which previously showed a deficit of 105.8B. This sequential flow requires operators to adjust risk exposure as liquidity migrates from Asian to European and finally American venues. A critical limitation arises when data revision protocols update prior figures; Trading Economics marks revised values with an asterisk to signal changes to the historical record. Ignoring these tags leads to backtesting errors where models train on superseded information. The cost of missing a timezone handover is measurable: price gaps often emerge before the next scheduled release, catching static alarms off guard. Operators should configure alerts around these specific handover windows rather than relying on broad daily summaries. Failure to align monitoring tools with the continuous global market hours results in delayed reactions to inflationary shocks.
Data Discrepancies in Third-Party Consensus Integration
Late-session data carry-overs create immediate valuation errors when platforms fail to reset consensus baselines between time zones. Aggregators merge official government releases with third-party survey data, a process that frequently misaligns timestamps during the 24-hour update cycle. Platforms technically integrate consensus figures from sources like Bloomberg alongside actual results, yet API-level aggregation often preserves stale inputs if the host system does not explicitly flag revisions. This mechanical failure causes the previous value to drift from the official statistic, generating false volatility signals for algorithms monitoring data discrepancies.
| Failure Mode | Technical Root Cause | Operational Impact |
|---|---|---|
| Stale Baseline | Cache expiration mismatch | False positive breakout signals |
| Source Drift | Unverified third-party overwrite | Incorrect consensus deviation calculation |
| Timestamp Lag | Timezone normalization error | Delayed reaction to actual prints |
The New York Fed's calendar avoids this noise by publishing only official dates without third-party consensus forecasts, contrasting sharply with commercial terminals that prioritize speed over verification. The limitation is clear: relying on unverified aggregation introduces a measurable latency between the primary source and the trader's screen. Network operators must treat third-party consensus integration as a derived signal rather than a primary source of truth. Blindly executing against these figures risks capital on data that may already be obsolete.
Strategic Framework for Integrating Macroeconomic Data into Investment Decisions
Defining Consensus Forecast Integration in Real-Time Trading
Integrating third-party consensus figures requires API-level aggregation to align disparate data sources with official releases. Platforms technically merge these external estimates alongside actual results to create a unified display for immediate deviation analysis. This infrastructure allows traders to visualize the gap between market expectations and realized economic performance instantly. Without such integration, operators risk misinterpreting initial prints against stale historical baselines. Data revision protocols further refine this process by marking updated historical values with an asterisk when authorities release corrected figures. This specific tagging mechanism ensures that backtesting models do not train on superseded initial estimates, preserving the integrity of historical trend analysis. Failure to distinguish between preliminary and revised data introduces significant noise into quantitative strategies.
| Feature | Function | Impact |
|---|---|---|
| Consensus Aggregation | Mizes third-party forecasts with official data | Enables real-time deviation calculation |
| Revision Tagging | Flags updated historical values | Prevents model contamination |
| Unified Display | Combines actuals and estimates | Reduces latency in decision loops |
The operational cost of this approach is the reliance on continuous data stream stability; any API interruption leaves the trader blind to the critical consensus versus actual differential. While official government calendars provide release times, they lack the integrated forecast layers necessary for proactive positioning. Consequently, the burden falls on the trader's system to maintain synchronous data feeds without introducing latency that could distort the timing of execution signals.
Executing Trades on USD Initial Jobless Claims and CPI Deviations
Execute USD entries at 12:30 GMT by comparing the 210K consensus against the 215K previous Initial Jobless Claims figure. A print below this threshold signals labor tightness that often strengthens the dollar before CPI data arrives. Traders must verify if historical values carry an asterisk indicating a revised prior, as trading on uncorrected baselines creates false deviation signals. Adjust portfolio exposure on Friday using the Germany CPI Y/Y release fixed at 2.40%. This inflation anchor dictates European Central Bank rate expectations and drives EUR/USD volatility independent of American data. Operators should treat any divergence between consensus and actuals as a primary trigger for position sizing rather than a directional cue alone. Retail traders often overleverage into this void expecting linear trends, only to face whipsaws from algorithmic rebalancing. ActionForex recommends waiting for the second candle close post-release to confirm momentum before committing capital. Ignoring this pause frequently results in entering trades precisely at local extremes.
Pre-Trade Validation Checklist for Global Release Cycles
Validate every timestamp against the 24-hour update cycle to prevent execution errors during off-peak liquidity windows. Operators must cross-reference the previous value of 2.50% for JPY Money Supply before the 23:50 GMT release to establish an accurate baseline for deviation analysis. Ignoring this step risks misinterpreting standard volatility as a trend reversal. The consensus forecast acts as the primary filter for noise, yet many traders fail to verify if the host system admits the latest revision before the bell. A common failure mode involves acting on uncorrected historical data, leading to immediate position drawdowns when the market prices in the corrected figure instantly. Retail participants often overlook that data revision tags alter the mathematical slope of the trend line used by algorithms. Confirm the revision protocol status on your terminal to ensure the baseline reflects the latest official correction. Without this verification, any calculated deviation represents a phantom opportunity rather than a tradable edge.
Execution Protocol for Trading High-Volatility Economic Events
Defining Consensus Deviation Triggers for Employment and PPI Data

Anchor trade entry to the specific deviation of the release from the curated list of consensus expectations. The schedule lists Net Change in Employment with a consensus of 10.0K against a previous value of 87.8K, alongside PPI Y/Y data showing a consensus of 6.80% compared to a prior reading of 6.30%.
- Calculate the absolute difference between the actual print and the consensus figure immediately upon release.
- Monitor the deviation against standard market expectations for high-impact indicators listed in the calendar.
- Evaluate whether the magnitude of the surprise warrants positioning based on historical volatility patterns for these specific events.
The limitation is that consensus forecasts often fail to account for rapid revisions in prior months, creating false signals. Traders must distinguish between a genuine structural shift and a statistical artifact before committing capital. Relying solely on the headline number without context from the previous baseline invites unnecessary risk during these volatile windows.
Executing Entry Orders on CAD Unemployment Rate and Building Permits Releases
Monitor the market around the 14:00 GMT timestamp when CAD Building Permits data is scheduled for release, noting a consensus of 0.50% against a previous contraction of -7.60%. 1.2.3. Note that the Unemployment Rate consensus stands at 6.60%, matching the previous rate of 6.60%, which may limit immediate volatility. A key limitation is that revised historical data, often marked with an asterisk on economic dashboards, can distort backtested volatility thresholds if not adjusted. Traders must recognize that a single permits reading lacks conviction without broader sector confirmation. The cost of ignoring data discrepancies is a false breakout on the substantial pair. Always verify the specific revision status of the previous month before committing capital to the move.
Pre-Event Validation Checklist for JPY PPI and EUR Germany CPI Final
Verify the revision status of the Germany Factory Orders and Industrial Production figures before their each releases using data revision protocols. Trading Economics notes that asterisks mark updated historical values, preventing analysis based on outdated initial releases. Confirm the consensus aligns with your high-impact indicators feed to avoid latency errors; for instance, verify the JPY Leading Economic Index consensus of 116.9 against the previous 116.1.1. Cross-reference the consensus forecast against multiple vendor feeds to rule out data corruption.
- Check for any asterisk markers on previous months that indicate a retrospective change to the baseline.
- Align your execution timing with the scheduled GMT release times, such as the 06:00 GMT slot for German data or the 05:00 GMT slot for JPY indices.
Traders often ignore that consensus forecasts for economic data can shift hours before release, invalidating pre-set alerts. The cost of missing a revised baseline is a false breakout signal during the liquidity crunch. Platforms offering impact ratings help filter noise, but manual verification remains mandatory. Users must treat unverified prints as invalid until the official timestamp confirms the final value.
About
Vikram Nair, Emerging Markets & Asia FX Writer at ForexCFD.top, brings necessary context to the weekly economic calendar. His daily work focuses on translating complex macro events into actionable insights for retail traders in Tier-2 and Tier-3 markets. While the calendar lists global data points, Nair specializes in identifying which releases truly impact emerging market pairs like USD/INR or USD/NGN. This specific expertise is vital because standard economic dates often trigger disproportionate volatility in developing economies due to local liquidity constraints and central bank interventions. At ForexCFD.top, an independent publication dedicated to regulation-aware trading education, Nair ensures that every scheduled event is framed within its legal and practical reality for traders in regions like India and Nigeria. By connecting raw consensus data to on-the-ground market mechanics, he helps readers navigate the economic week with a clear understanding of both opportunity and regulatory risk.
Conclusion
Scalability fails when the 24-hour update cycle introduces timestamp misalignments that distort backtested volatility thresholds. The operational cost of ignoring these discrepancies is a false breakout signal during critical liquidity crunches, particularly when Factory Orders rebound while Physical Output remains stagnant. You cannot rely on a single data point like the headline PCE price index to dictate strategy when underlying sector confirmation is absent. The divergence between new demand and actual production creates a fragile setup that demands rigorous pre-event validation rather than reactive trading.
Implement a strict protocol to verify revision status before any substantial release. Specifically, check for asterisk markers on historical data that indicate retrospective changes to the baseline before committing capital. This step is non-negotiable for navigating the volatile setup surrounding the JPY pair and the fixed 2.40% inflation anchor in Europe. Your immediate action this week is to cross-reference the consensus forecast for the upcoming Germany CPI Y/Y release against multiple vendor feeds to rule out data corruption before the 06:00 GMT slot. Treat unverified prints as invalid until the official timestamp confirms the final value. Protect your positions by ensuring your execution timing aligns perfectly with the scheduled release times found in the global and US economic calendar.
Frequently Asked Questions
The 4.1% PCE inflation rate indicates persistent pressure on prices. This forces central banks to maintain restrictive policies rather than pivot to lower rates immediately.
Japan's prior PPI high of 0.90% creates a volatile setup for currency pairs. Deviations from this level often trigger sharp algorithmic rebalancing across major forex markets.
A 0.20% PPI figure alongside different CPI data signals shifting consumer purchasing power. Traders use this divergence to anticipate central bank policy changes before official announcements occur.
Germany's previous 3.80% contraction in factory orders sets a low bar for new data. A rebound suggests improving sentiment, while another miss could deepen fears of regional stagnation.
Ignoring the 24-hour update cycle frequently misaligns timestamps during data releases. This technical glitch causes execution errors where traders enter positions based on stale or incorrect event times.
References
