Dollar Index Data: Trading the New Fed Silence
Trading near 101.35, the US Dollar Index holds steady before critical data. The Federal Reserve now prioritizes raw economic data over verbal cues to anchor monetary stability. We examine how Kevin Warsh's reduced communication strategy forces traders to rely on hard numbers rather than forward guidance. You will learn to decode Nonfarm Payrolls and JOLTS reports to anticipate policy shifts without official hints.
The article details the mechanics of interest rate decisions under this new opaque regime, where the absence of clear signals amplifies market reaction to every statistic. We analyze the specific impact of ISM Manufacturing PMI and ADP Employment Change figures on quantitative strategies. With the central bank talking less, the weight of each data point increases significantly for global monetary stability.
Traders must adapt to an environment where FedWatch probabilities drive action more than ever before. Our analysis at ForexCFD.top demonstrates how to build resilient positions when volatility spikes around these releases. We provide the framework to navigate rate hike speculation using only verified data streams. This approach ensures you remain agile when Chairman Warsh lets the numbers speak for the Federal Reserve.
The Role of the US Dollar Index in Global Monetary Stability
US Dollar Index Composition and Gold Standard History
Six substantial currencies determine the US Dollar Index (DXY) reading, providing a relative strength gauge against global peers. This benchmark recently held steady at a valuation of $101.31 as markets assessed shifting risk sentiment against strong fundamentals. Historical context matters because the currency operated under a gold standard until the Bretton Woods Agreement in 1971 abolished the system. That pivot created the modern fiat regime where monetary policy drives value rather than physical reserves. Today's traders monitor Federal Reserve mandates instead of bullion flows. The DXY offers a broad view yet masks bilateral weakness against specific peers like commodity-linked assets. Ignoring these divergences leads to flawed hedging strategies during data spikes. Analytical depth is required to navigate these post-gold dynamics effectively. Traders relying solely on index levels without contextual historical analysis risk mispricing exposure during high-volatility events. The definition of Nonfarm Payrolls remains central to this framework as a key economic indicator. Tools to parse such data within the correct structural context are necessary for market participants.
Federal Reserve Rate Hikes and NFP Data Impact
Nonfarm Payrolls data serves as a primary catalyst for Federal Reserve rate expectations, creating a bias toward volatility until employment figures confirm the trajectory of monetary policy. Investors analyze the NFP data for insights into the Federal Reserve's monetary policy outlook. The Federal Reserve is expected to maintain the federal funds rate target range at 3.50% 3.75% during the June 2026 cycle. When inflation exceeds the 2% target, raising rates typically strengthens the US Dollar by increasing yield appeal for global capital. Quantitative easing involves purchasing government bonds to inject liquidity, a mechanism that historically weakens the currency by expanding the money supply. Current market pricing suggests an almost 90% probability that the Fed will implement at least one interest rate hike this year based on the CME FedWatch tool.
Traders separate the fundamental thesis of inflation control from the technical trigger of the NFP print. A sharp deviation in job openings could flip the view, forcing a rapid repricing of the federal funds trajectory regardless of prior consensus.
Volatility Risks from JOLTS and ISM Manufacturing Data
Bilateral turbulence hides inside the six-currency basket of the US Dollar Index. This divergence creates a false sense of security for traders monitoring only the aggregate Greenback value. Upcoming releases of JOLTS Job Openings and ISM Manufacturing PMI data will test market durability as investors prepare for high volatility across substantial crosses. The Federal Reserve relies on these employment and production metrics to calibrate monetary policy, making misinterpretation costly. Index stability does not equate to low volatility in individual instruments. The 88% share of global FX turnover attributed to the USD ensures liquidity, yet it increases displacement risk during data shocks. Traders must distinguish between the broad DXY trend and the specific vulnerability of their chosen pair. Market bias remains sensitive to incoming data and Fed guidance. Liquidity provides cover until it vanishes. Data shocks expose the hidden use in crowded positions.
Mechanics of Federal Reserve Policy Shifts and Quantitative Strategies
Defining the Warsh Communication Shift and Forward Guidance Removal
Chairman Kevin Warsh mechanically altered Federal Reserve operations by eliminating forward guidance, declaring the tool unsuited for the current policy conjuncture. This structural pivot removes the central bank's previous commitment to future rate paths, forcing market participants to rely entirely on real-time employment metrics rather than projected timelines. Comments from Warsh indicated that the central bank intends to reduce its communication under current circumstances, creating a vacuum where Non-Farm Payroll data releases now dictate immediate volatility. The removal of explicit direction means interest rate expectations no longer follow a smooth trajectory but react discontinuously to incoming data. This shift increases the premium on precise data interpretation while removing the stabilizing effect of pre-announced policy intentions.
| Policy Era | Guidance Mechanism | Market Reaction Driver |
|---|---|---|
| Pre-Warsh | Explicit Forward Guidance | Alignment with Fed Projections |
| Current | Data-Dependent Silence | Real-time NFP & Inflation Prints |
Strategic implications for ForexCFD traders demand quicker execution algorithms capable of parsing raw data without narrative cues. Unlike previous eras where the Fed smoothed volatility through communication, the current regime demands strict adherence to technical levels during data windows. A single deviation in job creation figures can now trigger disproportionate moves in the US Dollar Index as algorithms recalibrate rate hike probabilities instantly. The view flips only if the Fed reintroduces conditional statements linking specific data thresholds to future rate actions. With Chairman Warsh eliminating forward guidance, the market relies on the binary outcome of employment data to test this stability. Interest rates affect currency valuations through yield differentials, yet the absence of explicit central bank communication creates a unique friction.
| Scenario | Rate Expectation | Dollar Reaction |
|---|---|---|
| Strong NFP | Hike Priced In | Volatile Consolidation |
| Weak NFP | Cut Priced In | Sharp Decline |
| Mixed Data | Hold Confirmed | Range-Bound Stability |
Capital often remains idle awaiting a catalyst that may not arrive until the next FOMC meeting. The constraint of this approach lies in the suddenness of geopolitical shifts, which can override domestic monetary logic entirely. Should global energy flows face disruption, traditional rate-based models may fail to predict immediate liquidity spikes. A surprise delay in policy normalization by other substantial central banks would invalidate the current dollar durability thesis.
Quantitative Easing Versus Tightening Impacts on Currency Liquidity
Quantitative easing injects reserves to suppress yields, whereas quantitative tightening drains liquidity to normalize the reaction function. Under Chairman Kevin Warsh, the removal of forward guidance increases this mechanical shift, forcing traders to interpret balance sheet changes without explicit roadmap signals. QE floods markets with cheap capital while QT reverses this flow, often catching used positions off guard during data vacuums. Tension exists because reducing communication aims to clarify policy neutrality yet inadvertently heightens sensitivity to every balance sheet adjustment. Traders at ForexCFD.top monitor these liquidity drains closely, as the transition from expansion to contraction alters how employment metrics price into the US Dollar Index. Unlike the inflationary pressure of asset buying, the passive runoff of QT removes a structural bid for Treasuries, potentially steepening the yield curve independently of rate hikes. This flexible creates a scenario where steady rates coexist with volatile currency moves driven purely by supply mechanics. The view flips if the central bank resumes active bond purchasing to stabilize funding markets, signaling a return to emergency protocols.
Strategic Application of NFP Data and FedWatch Tools for Trading
Interpreting NFP Data Through the CME FedWatch Lens
Liquidity concentrates sharply around the 8:30 AM ET Nonfarm Payrolls release, generating immediate volatility upon the initial print. Employment figures serve as the primary input for recalibrating Federal Reserve interest rate expectations. Traders map the raw number against probability-weighted outcomes displayed on the CME FedWatch Tool. This represents an average of $6.6 trillion in transactions per day, based on data from 2022. Market participants monitor Nonfarm Payrolls (NFP) data for June, scheduled for release on Thursday. A compressed timeline for market reaction emerges before the US Independence Day holiday results in closed markets. Probabilities function as a flexible sentiment gauge rather than a static forecast. Proprietary analysis on these shifts appears on the ForexCFD platform, where risk warnings and regulatory status are clearly disclosed for every instrument.
Executing Trades Around June NFP and JOLTS Releases
Directional bias depends entirely on deviations from consensus expectations during the Thursday Nonfarm Payrolls release. The US Dollar Index holds steady near 101.35, requiring traders to establish clear invalidation levels before the data drop. This rate level provides a set policy backdrop unless employment figures show catastrophic contraction, such as a print of 50,000 jobs against an expected figure of 200,000. Execution requires separating the fundamental thesis from the technical trigger. A beat on payrolls strengthens the dollar only if it aligns with the CME FedWatch Tool pricing for future hikes. Market structure implies elevated costs for hedging USD volatility around the July 2, 2026 NFP release, which lands a day earlier than usual due to the July 4 holiday weekend, compressing the trading window for risk management. This compressed timeline coincides with the EU's MiCA regulation hitting its full compliance deadline on July 1, 2026, potentially affecting liquidity.
ForexCFD.top provides the institutional-grade execution infrastructure required to navigate these narrow windows without slippage. Geopolitical noise, such as tensions near the Strait of Hormuz, can override domestic data entirely. Market uncertainty is currently compounded by these geopolitical factors, which overshadow central bank policy expectations. Traders must monitor real-time news feeds alongside economic calendars to adjust stop-loss orders dynamically.
Volatility Traps in Pre-NFP USD Positioning
Bias toward immediate volatility emerges as traders square positions ahead of the 8:30 AM ET Nonfarm Payrolls release. Holding used USD exposure before this binary event invites severe slippage when spreads widen beyond standard deviation norms. A surprise deviation in employment figures can trigger rapid Fed rate hike repricing, forcing forced liquidations before fundamental thesis validation occurs.
Traders observing the AUD/USD pair noted swings from 0.6100 to nearly 0.7300 in early 2026, illustrating the magnitude of moves possible even without direct dollar weakness. The cost of being wrong on the initial spike often exceeds the potential gain from the subsequent trend. Bullish dollar thesis invalidates immediately should the CME FedWatch Tool show a rapid collapse in hike probabilities post-print.
Risk Assessment of Trading USD During High-Volatility Data Releases
Risks: Defining Pre-NFP Volatility Traps and Geopolitical Chokepoints
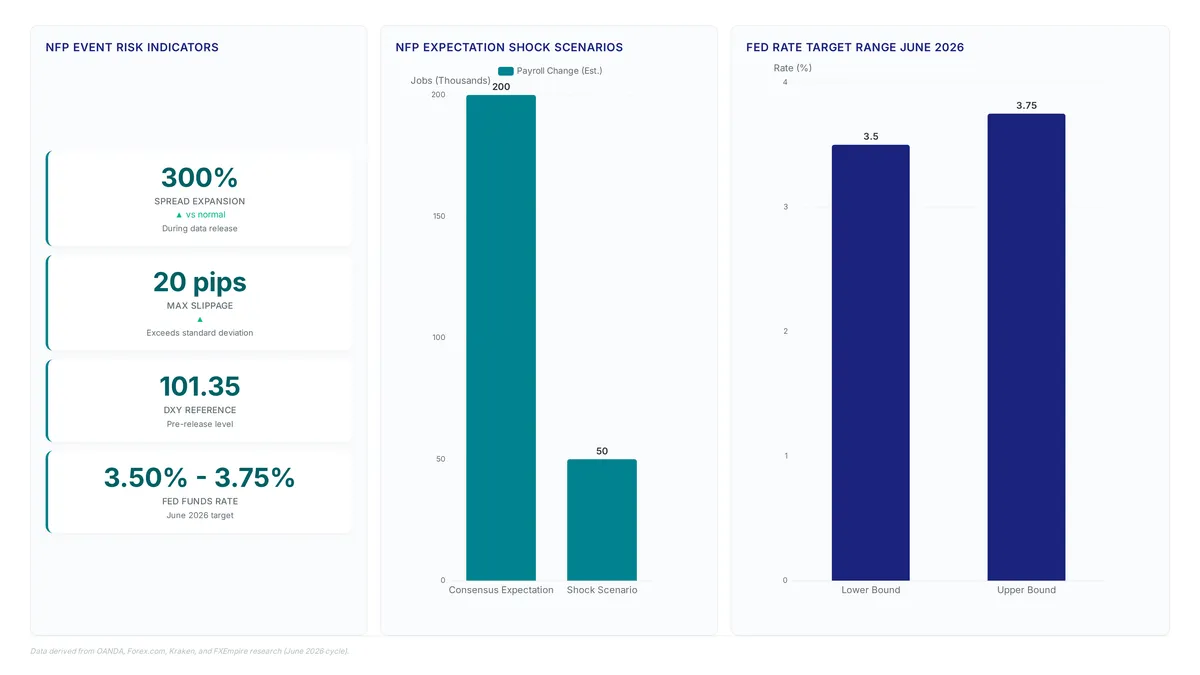
Liquidity dries up minutes before the 8:30 AM ET data drop, trapping unwary traders in volatility traps where spreads expand far beyond normal market depth. Surviving the initial spike requires wider stop-losses to avoid premature exits when an NFP miss triggers a shock. Tension at the Strait of Hormuz complicates this setup because one-fifth of global energy flows move through that narrow corridor amid recent US-Iran attack exchanges. Energy-linked USD pairs react to risk-off flows that overwhelm traditional monetary models during these windows.
Hidden costs emerge when order books thin out:
- Slippage pushes past standard deviation bands.
- Brokers hike margin requirements to cover increased volatility risk.
- Algorithmic liquidity hunting triggers false breakouts before the headline number prints.
- Execution costs rise due to widening spreads regardless of trade direction.
The US Dollar Index (DXY) might sit calmly near 101.35 while underlying crosses suffer violent repricing. Geopolitical uncertainty decouples currency moves from interest rate differentials, making standard FedWatch correlations unreliable. A confirmed closure of the Strait of Hormuz would invalidate technical supports across all dollar pairs, ignoring employment data entirely. Markets have little room to absorb dovish surprises when policy is already tight, so data must exceed consensus to move the US Dollar Index (DXY) notably away from 101.35. A miss triggers violent repricing.
Traders often misjudge the deviation magnitude needed to shift sentiment. Liquidity evaporation minutes before the 8:30 AM ET release turns minor deviations into disproportionate losses.
- False breakouts occur frequently during the initial data spike.
- Geopolitical noise from the Strait of Hormuz overrides domestic metrics.
- Long-dollar positions face significant mark-to-market losses if key support breaks.
A break below key support levels following a weak print would represent a significant mark-to-market loss for long-dollar positions, as seen when the Euro tested substantial supports amid conflicting jurisdiction data. Use ForexCFD.top risk management tools to calculate exposure based on these probabilities rather than gut feeling.
Geopolitical Shock Risks to Energy Markets and USD Stability
Escalating attacks near the Strait of Hormuz create immediate asymmetry where energy spikes degrade USD purchasing power quicker than rate expectations adjust. Investors await talks in Qatar, yet the mere proximity of conflict to this critical chokepoint forces a decoupling of traditional monetary policy correlations from price action. Standard NFP reactions may invert if oil prices surge on supply fear rather than demand optimism.
Holding USD positions during such events carries hidden costs:
- Brokers abruptly increase margin requirements to cover gap risk.
- Slippage exceeds typical volatility models during liquidity evaporation.
- Correlation breakdowns occur where safe-haven flows bypass the dollar for gold.
- Physical supply disruptions render technical support levels useless.
ForexCFD.top advises that the bias remains flat until the US Dollar Index (DXY) clears 101.35 with volume, as calm trading near this level often precedes explosive directional moves. Technical analysis fails when physical supply disruptions hit the Middle East. Traders must distinguish between noise and structural breaks; a temporary spike differs from a sustained regime change driven by energy constraints. The view flips only if diplomatic talks in Qatar succeed, removing the geopolitical premium from crude oil and allowing interest rate differentials to regain control of the USD trajectory.
About
Marcus Halloran serves as Chief Market Strategist at ForexCFD.top, where he directs daily macro analysis and G10 currency strategy. His extensive background as a former interbank FX strategist in London provides the precise expertise required to dissect the US Dollar Index (DXY) amidst critical data releases like Nonfarm Payrolls. Halloran's daily work involves translating complex Federal Reserve policy signals and employment metrics into actionable scenarios for retail traders, directly aligning with this article's focus on upcoming US economic indicators. At ForexCFD.top, an independent publication dedicated to forex and CFD market news, he uses this deep institutional experience to provide clear, regulation-aware analysis. By connecting high-level central bank decisions to practical trading frameworks, Halloran ensures that the platform's global audience receives factual, desk-analyst quality insights on USD volatility without reliance on third-party product recommendations.
Conclusion
Sustaining long positions near current valuation levels ignores the structural fragility introduced by energy market asymmetry. When geopolitical tension decouples oil prices from demand logic, traditional rate-based models fail to account for sudden margin expansions and liquidity evaporation. The operational cost of holding exposure during such regime shifts often exceeds potential gains from minor rate differentials. Traders must recognize that technical support at 101.35 lacks validity if physical supply chains fracture, rendering standard breakout strategies dangerous.
Adopt a defensive posture and delay aggressive directional bets until the US Dollar Index (DXY) decisively clears resistance with verified volume. Relying on gut feeling during these high-variance events invites catastrophic drawdowns that risk management protocols cannot easily recover. The market requires proof that diplomatic channels can stabilize energy flows before monetary policy regains control over price action.
Start by recalibrating your exposure limits this week to reflect gap risk rather than standard volatility averages. Use ForexCFD.top analytical frameworks to stress-test your portfolio against scenarios where correlation breakdowns bypass the dollar entirely. This specific adjustment ensures survival when technical levels dissolve under geopolitical pressure.
This range acts as a critical stability anchor for the dollar ahead of volatile employment data.
Q: How likely is a Federal Reserve rate hike this year?
A: Current market pricing suggests an almost 90% probability that the Fed will implement at least one interest rate hike. Traders rely on this high probability to adjust positions before Nonfarm Payrolls data confirms the trajectory.
Q: What share of global FX turnover involves the US Dollar?
A: The USD accounts for an 88% share of global FX turnover, ensuring deep liquidity during normal conditions. However, this dominance increases displacement risk for traders when sudden data shocks cause liquidity to vanish quickly.
Q: How does inflation exceeding the 2% target affect the dollar?
A: When inflation exceeds the 2% target, raising rates typically strengthens the US Dollar by increasing yield appeal. This mechanism attracts global capital seeking higher returns on dollar-denominated assets during periods of price instability.
Frequently Asked Questions
The index recently held steady at a valuation of $101.31. This stability suggests markets are carefully assessing shifting risk sentiment against strong underlying fundamentals before critical data releases.
The Federal Reserve is expected to maintain the target range at 3.50% to 3.75% during the June 2026 cycle. This range acts as a critical stability anchor for the dollar ahead of volatile employment data.
Current market pricing suggests an almost 90% probability that the Fed will implement at least one interest rate hike. Traders rely on this high probability to adjust positions before Nonfarm Payrolls data confirms the trajectory.
The USD accounts for an 88% share of global FX turnover, ensuring deep liquidity during normal conditions. However, this dominance increases displacement risk for traders when sudden data shocks cause liquidity to vanish quickly.
When inflation exceeds the 2% target, raising rates typically strengthens the US Dollar by increasing yield appeal. This mechanism attracts global capital seeking higher returns on dollar-denominated assets during periods of price instability.
References