Rate cuts delayed: Why 2027 is the new target
Money markets assign less than a 10% probability to a February 2026 rate cut. That single statistic defines the immediate future: stagnation for the federal funds rate.
Persistent inflation and slowing growth will delay monetary relief until 2027. This timeline forces a hard divergence between official forecasts and market pricing. The Federal Reserve will hold steady despite economic headwinds, waiting for specific triggers before adjusting the fed funds rate target. We must dissect how core inflation drivers like energy prices and tariffs interact with fading AI investment boosts to shape the trajectory toward price stability.
GDP growth is projected to dip further through 2027 as private fixed investment contracts outside the technology sector. Morningstar data shows unemployment ticking up to 4.6% in 2027, a direct result of reduced labor demand amid slower expansion. The expected cumulative 1 percentage point reduction in rates by 2028 contrasts sharply with current market expectations that incorrectly price in earlier hikes. Understanding these productivity shifts and policy constraints is necessary for anticipating when the fed funds rate target range will finally move below current levels.
Core Inflation Drivers and the 2027 Price Stability Trajectory
Defining Core Goods Inflation and the 2025 Tariff Impact
Core goods inflation tracks price changes in tradable physical items while excluding volatile food and energy sectors. In 2025, the previous downward trend in inflation ceased, with the headline rate holding at 2.6%. Tariffs directly impacted this metric, contributing approximately 0.2 percentage points to the 2025 inflation rate.
This static environment set the stage for a sharper rise in 2026, where inflation climbs to 3.4%. Unlike the prior year's trade-driven pressure, the primary driver shifts to geopolitical instability known as the Iran war. Higher oil prices resulting from this conflict add roughly 0.6 percentage points to the 2026 forecast. Goods inflation may stabilize once tariffs are absorbed, yet energy volatility embeds itself into broader cost structures. Anticipating the Federal Reserve's response requires isolating these specific vectors rather than reacting to the aggregate headline alone. The Iran war disrupts global supply chains to create an energy shock that adds approximately 0.6 percentage points to the headline forecast. Such a surge represents a distinct departure from the tariff-driven pressures observed in the prior year.
Market participants currently expect either one or two rate cuts from the Federal Reserve throughout the entirety of 2026. Such a stance reflects the central bank's commitment to anchoring expectations despite growth headwinds. GDP growth slows, but the persistence of elevated energy costs forces a recalibration of the price stability timeline. The path back to target relies heavily on receding energy prices in 2027.
Trading metals on margin during such volatile geopolitical events carries significant risk of rapid capital loss. Money markets currently assign less than a 10% probability to a rate cut by February 2026, reflecting heightened caution among investors regarding near-term liquidity.
2025 Tariff Pressures Versus 2027 Energy Price Relief
Tariff mechanics create a one-time price level shift rather than a persistent inflationary spiral. The 0.2 percentage point contribution from trade barriers in 2025 represents a static cost push that dissipates once the policy impact ceases going forward. Conversely, the 2027 environment features receding energy prices generating a sustained negative impulse to the headline rate. This flexible contrasts sharply with the transient nature of goods-based pressures because energy flows continuously through production and transport costs.
Wage growth has slowed considerably, a development that should help push services inflation back to normal levels. Timing is the catch. Tariff effects vanish immediately upon policy stabilization, but the disinflationary benefit of lower wages requires a lagged adjustment in labor contracts. Slowing wage data does not instantly translate to lower consumer prices due to these sticky contractual arrangements. The Morningstar thesis suggests this delayed reacceleration of real purchasing power will only fully materialize after the 2027 slowdown. Investors must distinguish between the ceased impact of trade wars and the unfolding relief from labor market cooling.
GDP Growth Mechanics Amid AI Investment and Productivity Shifts
How AI Investment Distorts GDP Growth Calculations
Massive artificial intelligence capital expenditure inflates investment metrics while broader output stagnates. This mechanical disconnect occurs because total private fixed investment, excluding technology-related categories buoyed by artificial intelligence, has been contracting since 2025. Consequently, GDP growth has been trending down, posting at 2.1% in 2025, which is 0.7 percentage points lower than the 2022-24 average of 2.8%. The distortion arises when sector-specific surges mask widespread contraction in non-tech industries.
Delayed policy responses to underlying fragility define the current cost of this statistical anomaly. High borrowing costs persist as the federal funds rate remains pinned between 3.50% and 3.75% through at least June 2026, delaying the anticipated reacceleration of economic activity. Operators must recognize that current headlines overstate economic health due to this narrow concentration of spending. The limitation of relying on aggregate figures is the inability to see shrinking demand in traditional sectors until unemployment rises. Forecasts indicate that once AI spending normalizes, the boost to GDP growth will diminish notably. Investors interpreting these signals should note that the apparent strength in capital formation is an illusion created by a single industry's expansion.
Federal Reserve Rate Cut Mechanics Driving 2027 Reacceleration
Lingering high rates suppress output until monetary policy shifts decisively in 2027. While borrowing costs stabilize, the full economic impact of previous tightening lags, creating a temporary drag on GDP growth outlook. By September 2025, the Federal Reserve had already executed rate cuts totaling 175 basis points, moving the policy stance notably closer to neutral. The mechanism driving reacceleration relies on the Federal Reserve cutting rates by a cumulative 1 percentage point across 2027 and 2028. This specific trajectory targets a terminal range of 2.50% to 2.75%, down from current restrictive levels. Such easing directly addresses the root causes of slowdown by lowering capital costs for non-AI sectors that have contracted since 2025.
The data-dependent caution displayed by central bankers means any resurgence in price pressures could delay these anticipated cuts. If the Fed fails to loosen policy as projected, economic activity may stall further before any rebound occurs.
Operators must recognize that substantial further interest rate cuts will be needed to drive longer-run borrowing rates down, thereby supporting continued, strong economic growth. This combination is projected to lead the Fed to cut interest rates over 2027 and 2028, causing GDP growth to reaccelerate in the later years of the forecast. The divergence between market pricing and official forecasts creates volatility, demanding precise navigation of interest rate sensitivity.
Tariff Pressures and Immigration Decline as GDP Drag Factors
Specific policy headwinds now act as the primary brake on domestic output despite technological surges. Key drivers and themes affecting GDP include policy changes, including the impact of tariffs and lower population growth via immigration. This price shock erodes real consumer purchasing power just as demographic tailwinds weaken. Lower population growth via immigration removes a traditional pillar of labor force expansion, creating a structural deficit that AI efficiency cannot immediately offset.
However, the timing of these drags creates a dangerous tension for monetary planners. While tariffs spike prices temporarily, the labor shortage persists structurally, forcing the Federal Reserve to balance inflation containment against growth preservation. Investors must recognize that GDP growth outlook deterioration stems from these structural and policy factors alongside the lingering effect of high interest rates. The lingering effect of high interest rates compounds this pain by raising borrowing costs for small businesses unable to access equity markets.
Federal Reserve Rate Forecasts Versus Market Pricing Reality
Defining the Federal Reserve Rate Forecast Divergence
Official projections and market pricing sit apart by a 1.25 percentage point gap at the close of 2028. Traders anticipate the fed-funds rate climbing in 2027 before flattening out, whereas the Federal Reserve sees a slow normalization path. Economic growth could decelerate enough to mandate a reactive pivot if the central bank does not loosen policy as expected. Participants largely price in just one or two cuts during all of 2026, which stretches the duration of restrictive monetary policy. Market logic assumes sticky inflation blocks the very reductions the Fed considers necessary for a soft landing. Real yields drive the opportunity cost for gold far more than headline fear does, making this spread vital for traders. Timing mismatches frequently trigger sharp swings in used books. Analysts check this money market data to test official guidance, observing that the fed-funds rate stays flat through 2026 despite widespread hopes for relief. Tension builds between the projected path and actual trader behavior because the price of certainty stays elevated.
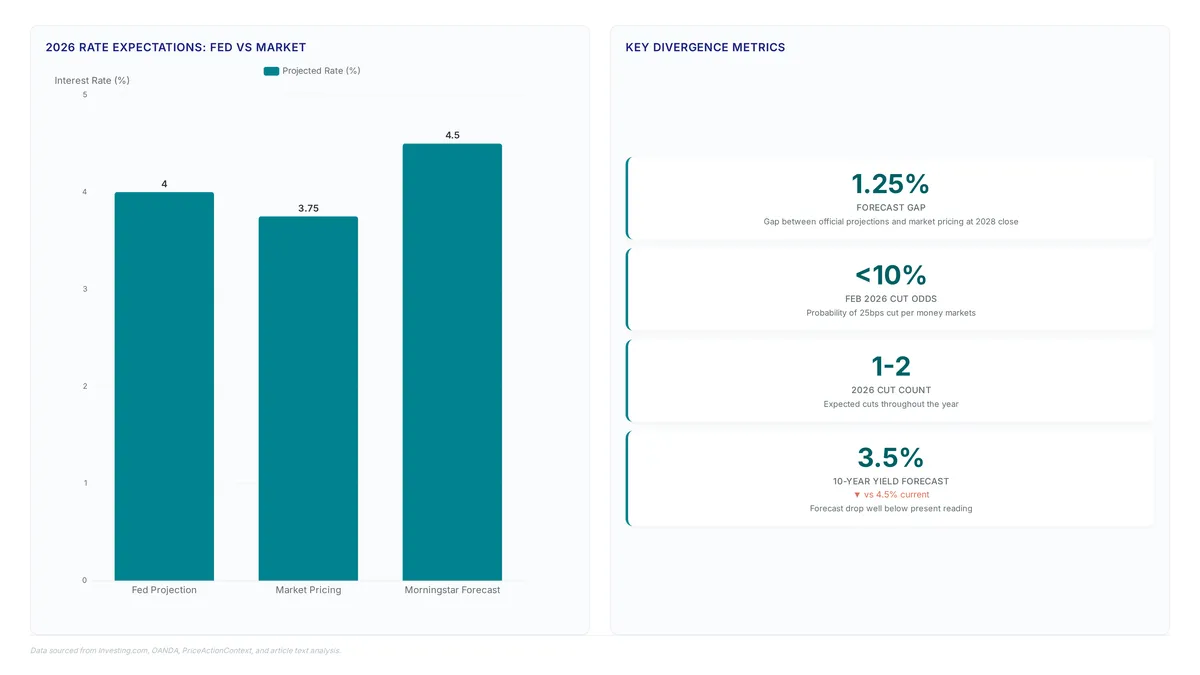
Volatility lurks within this divergence since markets price a federal funds rate hike in 2027 while official models call for reductions. Portfolio managers must balance the threat of a policy error against the probability of enduring inflation. The Federal Reserve faces a tough calibration act if growth slows without the expected loosening of financial conditions. This outlook relies on inflation pressures fading enough to allow four cumulative cuts over two years. Markets disagree materially by forecasting a 2027 rate hike followed by stability, generating that 1.25 percentage point spread against the central bank view. Parallel stress shows up in long-duration bonds where the 10-year Treasury yield is forecast to drop to 3.5% well below its present 4.5% reading. A critical limitation exists: if the central bank fails to loosen conditions as predicted, economic activity may slow enough to force their hand regardless of initial resistance.
Gold traders must watch this yield compression closely since real yields often dictate metal performance more than nominal dollar strength. Should the Treasury yield fail to break below 4.00% despite Fed signaling, the bullish thesis for non-yielding assets faces immediate invalidation. Used positions on XAUUSD require tight stops below key support levels as volatility expands during policy recalibration. Remember that swaps on precious metals incur overnight financing charges that can erode profits in sideways markets; Islamic accounts offering swap-free trading are available for those requiring Sharia-compliant structures. Trading used commodities carries significant risk of loss.
Strategic Asset Allocation Based on Treasury Yield Expectations
Defining Strategic Allocation via Treasury Yield Curve Signals
An inverted yield curve currently signals a delayed recovery rather than immediate expansion. Monetary policy takes time to filter through to real output. The central bank projects rate cuts across 2027 and 2028, yet the full beneficial impact on growth metrics will not materialize until after a distinct slowdown. Data suggests the unemployment rate could rise to 4.6% in 2027 before any meaningful rebound occurs. This timeline creates specific tension for asset managers who position for long-term yield declines too early, exposing portfolios to volatility from sticky inflation.
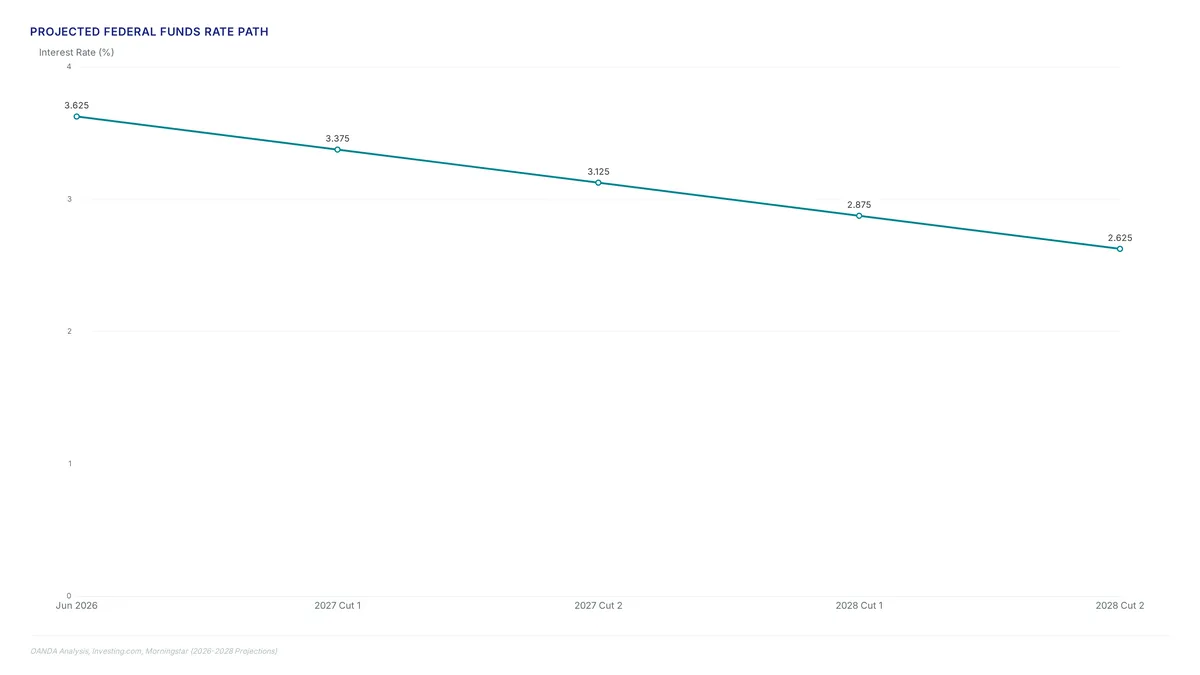
Current modeling faces a constraint as returns from artificial intelligence spending diminish and normalize. Technology investment alone cannot offset contracting private fixed investment outside the sector. Consensus forecasts often overestimate the speed of GDP growth recovery following such deep inversions. The strategic imperative remains defensive until the yield curve steepens, a move confirmed by actual rate reductions rather than market speculation. The mechanism relies on the inverse relationship between bond prices and yields. Locking in current rates before the Federal Reserve executes two cuts in 2027 and two more in 2028 generates significant mark-to-market value. OANDA analysis confirms this plateau persists through mid-2026, creating a finite window for entry before yields compress.
Short-term rolling strategies benefit from current high yields while long-duration positions suffer immediate principal loss if the Federal Reserve delays normalization beyond 2027. Investors following the Morningstar inflation forecast 2027 must accept volatility in exchange for terminal wealth appreciation. Premature extension before the actual cutting cycle begins exposes portfolios to mark-to-market drawdowns without the offset of coupon reinvestment at higher rates. Timing the pivot from income focus to capital appreciation defines the 2027-2028 alpha.
This disparity supports the US Dollar against the Euro as the Fed's 'higher-for-longer' stance contrasts with ECB inflation convergence dynamics, directly impacting hedging costs and international trade pricing. OANDA analysis confirms this plateau persists through mid-2026, forcing treasurers to pay a premium for forward cover that was unnecessary in synchronized cycles. Firms locking hedges based solely on yield spreads face margin calls when volatility spikes unrelated to central bank rhetoric. Ignoring this desynchronization risks eroding thin export margins quicker than operational inefficiencies. Strategic allocation must account for the lag between policy signals and currency valuations.
About
Aisha Rahman, Gold & Commodities Analyst at ForexCFD.top, brings specialized expertise to the analysis of the federal-funds rate and its ripple effects on global markets. Her daily work focuses on dissecting how central bank decisions, particularly from the FOMC, directly impact gold prices, real yields, and commodity-linked currencies. Because gold often acts as a barometer for inflation expectations and interest rate trajectories, Aisha's deep understanding of these correlations allows her to translate complex macroeconomic forecasts into actionable insights for retail traders. At ForexCFD.top, an independent publication dedicated to vendor-neutral market analysis, she connects high-level economic data, such as GDP trends and inflation targets, to practical trading scenarios. This article uses her experience in monitoring how shifting rate environments influence safe-haven flows and asset valuations, ensuring readers receive clear, factual context on what future Fed cuts mean for their portfolios without unnecessary hype.
Conclusion
Stagnant growth meeting persistent inflation breaks the current equilibrium. Traditional yield-chasing becomes dangerous in this environment. Investors must recognize that the window for locking in federal funds target rate advantages is closing quicker than historical averages suggest. While markets price in eventual relief, the operational cost of waiting for a pivot that may not materialize until after mid-2026 is too high for used balance sheets. The strategy must shift from anticipating immediate cuts to managing duration risk within the established 3.50% to 3.75% corridor.
Treat the current plateau as a fixed constraint rather than a temporary anomaly. Portfolios heavily weighted toward long-duration assets should rebalance immediately to mitigate mark-to-market exposure if the fed funds rate target remains restrictive longer than consensus models predict. This approach prioritizes capital preservation over speculative timing of a policy shift that data suggests is still distant.
Start by auditing your fixed-income maturity profile this week to ensure no single position relies on a rate cut occurring before June 2026. Adjusting duration now secures yield without betting against the central bank's stated commitment to maintaining restrictive policy through the next fiscal cycle.
This low likelihood signals that investors should prepare for the federal funds rate to remain pinned between 3.50% and 3.75% through mid-year.
Q: How do tariffs and energy shocks impact the 2026 inflation forecast?
A: Inflation climbs to 3.4% in 2026 driven largely by energy shocks adding 0.6 percentage points. Readers must distinguish this from 2025 tariff impacts, as energy volatility embeds deeper into production costs than previous trade barriers did.
Q: Why is GDP growth slowing despite heavy investment in artificial intelligence?
A: GDP growth posted at 2.1% in 2025, which is significantly lower than the 2.8% average seen from 2022 to 2024. This slowdown occurs because private fixed investment outside the technology sector has been contracting since last year.
Q: What unemployment rate should investors expect during the 2027 economic slowdown?
A: The unemployment rate is expected to tick up to an average 4.6% in 2027 due to reduced labor demand. This rise reflects slower expansion and necessitates cautious asset allocation before monetary relief arrives in 2028.
Q: What is the projected terminal range for the federal funds rate by 2028?
A: The trajectory targets a terminal range of 2.50% to 2.75% by the end of 2028 after cumulative cuts. This represents a significant drop from current restrictive levels and aims to reaccelerate growth in later forecast years.
Frequently Asked Questions
Money markets assign less than a 10% probability to a rate cut by February 2026. This low likelihood signals that investors should prepare for the federal funds rate to remain pinned between 3.50% and 3.75% through mid-year.
Inflation climbs to 3.4% in 2026 driven largely by energy shocks adding 0.6 percentage points. Readers must distinguish this from 2025 tariff impacts, as energy volatility embeds deeper into production costs than previous trade barriers did.
GDP growth posted at 2.1% in 2025, which is significantly lower than the 2.8% average seen from 2022 to 2024. This slowdown occurs because private fixed investment outside the technology sector has been contracting since last year.
The unemployment rate is expected to tick up to an average 4.6% in 2027 due to reduced labor demand. This rise reflects slower expansion and necessitates cautious asset allocation before monetary relief arrives in 2028.
The trajectory targets a terminal range of 2.50% to 2.75% by the end of 2028 after cumulative cuts. This represents a significant drop from current restrictive levels and aims to reaccelerate growth in later forecast years.
References