Federal Reserve Rate Hike Odds Hit 87%: My Take
With 87% odds of a rate hike per CME FedWatch, the Fed is aggressively pivoting to crush inflation.
The Federal Reserve has executed a sharp doctrinal shift. Nine of 19 FOMC policymakers now project an interest rate increase this year, a stark reversal from March's consensus against tightening. This sudden hawkishness drives the core thesis: monetary policy mandates for price stability are overriding growth concerns, forcing immediate currency market recalibrations. As the US Dollar Index climbs to 101.05, traders must recognize that central bank projections, not just raw data, are the primary engines of volatility.
Passive holding is dead. Understanding the interplay between regional Reserve Bank rotations and real-time liquidity concentration among reporting dealers is now mandatory. With North America driving a significant share of market growth, the stakes for misinterpreting these Federal Reserve signals have never been higher. We also face a looming variable: AI agent-intermediated transactions. Gartner predicts these could route $15 trillion through automated exchanges by 2028, adding a layer of algorithmic complexity to traditional interest rate speculation. (Gartner's strategic predictions for 2026)
The Role of Federal Reserve Mandates in Shaping Currency Markets
Federal Reserve Dual Mandate and 2% Inflation Target Definition
Statutory goals of price stability and maximum employment drive Federal Reserve monetary policy. This central bank, holding a balance sheet of roughly $6.7 trillion, adjusts the federal funds rate to manage economic temperature. Rate cuts stimulate activity when unemployment rises. A "hawkish" stance describes a policy preference for higher rates to combat rising prices, directly strengthening the US Dollar.
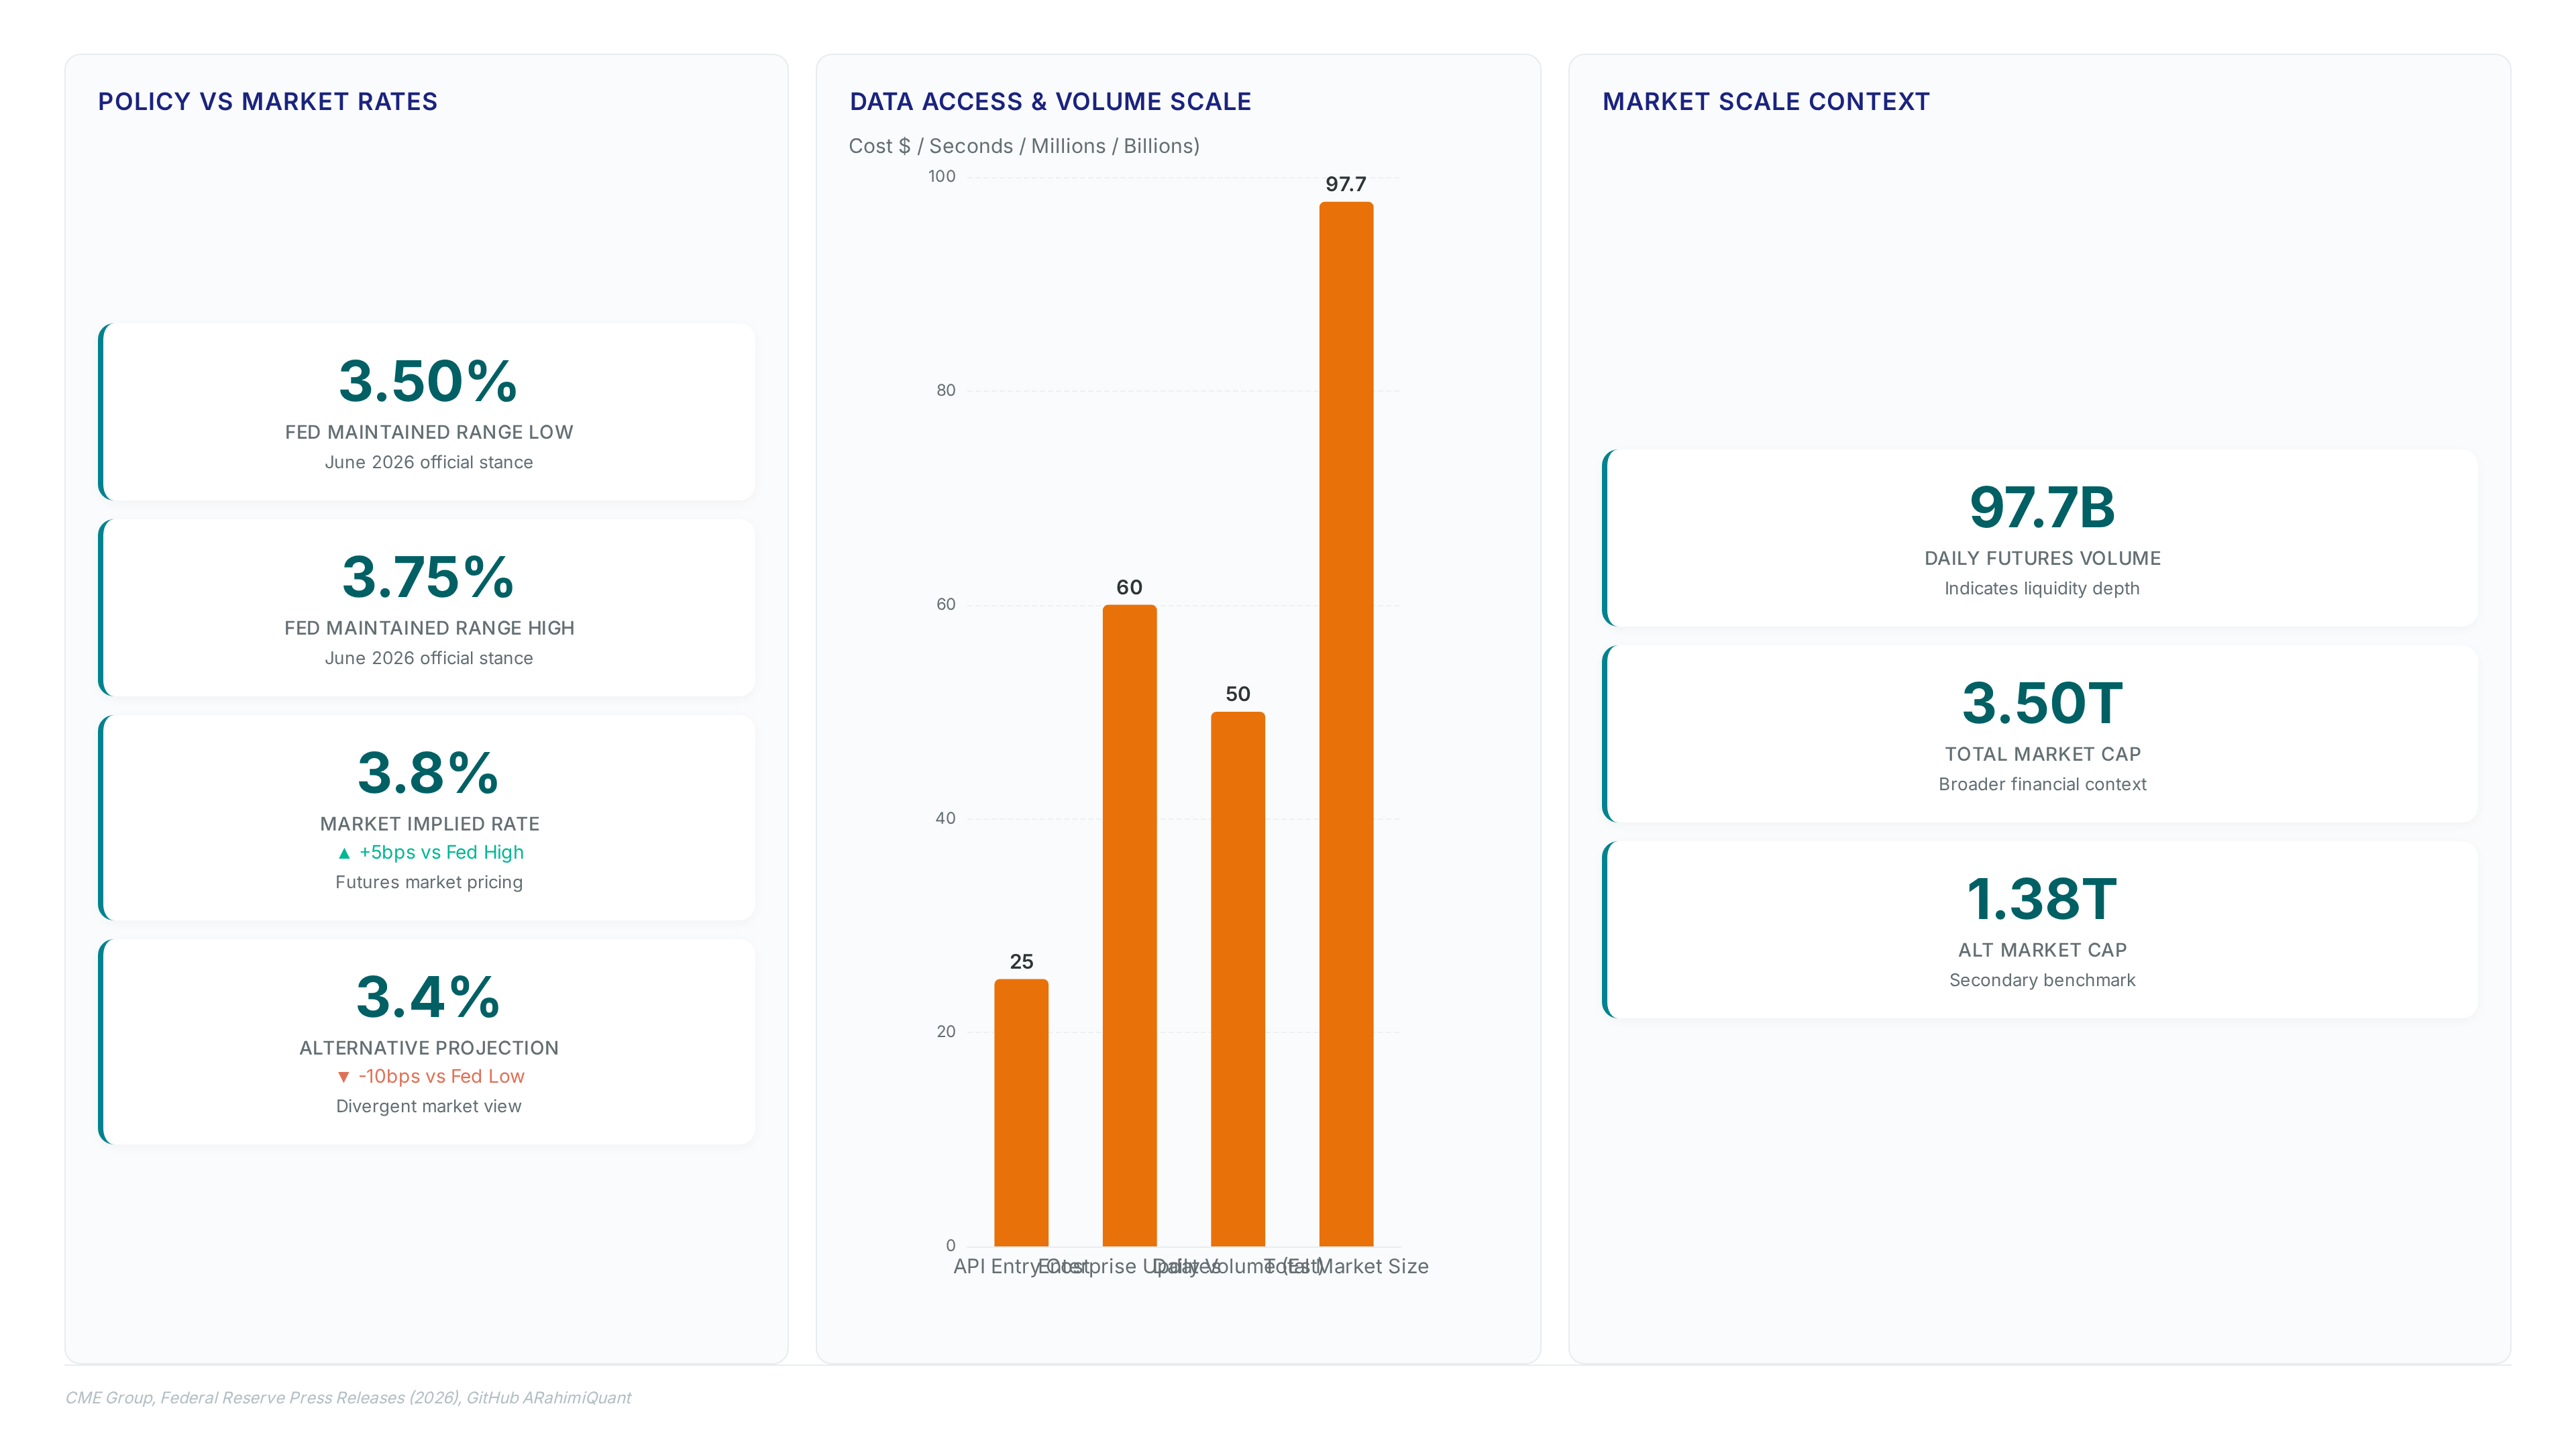
Current projections indicate an 87% probability of rate increases within the year, reflecting intense pressure from persistent inflation. The FOMC recently voted to maintain the target range at 3.50% to 3.75%, yet market pricing diverges from this official hold. Currency traders face volatility because the policy and market expectation do not align. Reliance on granular data like PCE reports replaces dependence on broad headlines. Lagging employment data often conflicts with real-time price signals in operational reality. Policymakers weigh immediate price surges against delayed labor market responses. Rate decisions appear reactive yet rely on forward-looking projections that markets frequently misprice. Traders interpreting the dual mandate must account for this specific latency in employment metrics.
Quantitative Easing Impact on USD During 2008 Crisis
Quantitative Easing functions as a non-standard mechanism where the central bank purchases high-grade bonds to force credit flow during systemic failures. This policy debuted prominently in 2008 when standard interest rate tools reached their lower bound. The Federal Reserve created new reserves to buy assets, a move that typically depresses the US Dollar by expanding the monetary base. Historical records show transfers reaching $97.7 billion in surplus years, illustrating the sheer scale of liquidity management possible under such regimes. Distinct valuation pressures emerge from the divergence between QE and Quantitative Tightening on currency markets.
Quantitative Tightening vs QE Effects on Dollar Value
Quantitative Tightening mechanically reverses Quantitative Easing by halting bond purchases and letting principal mature without reinvestment. This contraction reduces liquidity, creating upward pressure on the US Dollar opposite to the weakening effect of asset expansion. Global reserve strategies increase these moves as US official reserve assets totaling roughly $254.6 billion remain modest against foreign peers.
Market pricing often diverges from official stances, creating volatility when futures imply hikes while the Fed holds rates at 3.65 percent. Technical adjustments to indexation further complicate historical analysis of the Broad and EME dollar indexes used by traders. Speed of normalization matters more than direction. Rapid balance sheet reduction can fracture funding markets if liquidity vanishes too quickly. Operators must watch for stress signals in short-term funding rates rather than relying solely on headline inflation data. The cost of misjudging this transition is a sharp, disorderly spike in borrowing costs that undermines the very stability the Fed seeks.
How FOMC Projections and Rate Decisions Drive USD Volatility
FOMC Voting Structure and Rotating Regional Bank Presidents
Twelve officials cast votes on monetary policy, comprising seven Board governors, the New York Fed president, and four rotating regional leaders. The Federal Open Market Committee structure ensures geographic diversity while maintaining centralized control over the federal funds rate. Permanent seats include the Board of Governors and the Federal Reserve Bank of New York president, who executes all open market transactions. The remaining four voting slots rotate annually among the other eleven regional bank presidents, creating a shifting flexibility in policy deliberations.
This rotation means regional economic conditions periodically gain direct influence over national rate projections. Market volatility often spikes when rotating voters express divergent views from the median projection of 3.8%. The June 17, 2026 decision to hold rates at 3-1/2 to 3-3/4 percent reflected this complex internal consensus building. Unanimous votes, such as the interest rate maintenance on April 29, 2026, signal strong alignment, whereas split decisions highlight regional fractures. Traders must monitor which regional banks hold voting seats, as their specific economic exposures can skew the collective hawkish or dovish tilt. A manufacturing-heavy district president may prioritize growth over inflation, altering the USD trajectory compared to a financial-hub representative.
Translating Dot Plot Shifts into USD Volatility Spikes
The pivot where nine policymakers now foresee a rate hike, up from zero in March, forces immediate repricing of currency pairs. Market participants monitor the CME FedWatch tool as the primary gauge for these probability shifts. When the dot plot moves hawkish, traders execute buy orders on the US Dollar before the official vote occurs. This front-running creates sharp intraday volatility spikes around projection releases.
Access to real-time probability data costs as little as $25 per month for enterprise integration, allowing firms to automate reactions to FOMC signals. The limitation remains that projections are not commitments; a miss on upcoming PCE data could invalidate the hawkish skew instantly. Operators must distinguish between the median view and the actual policy directive issued on June 17, 2026. Traders relying on API specifications for intraday updates face latency risks during high-volume releases. A sudden reversal in sentiment would crush long positions built on the current consensus.
Target Range Maintenance Versus End-Year Projection Divergence
The decision to hold the federal funds rate at 3-1/2 to 3-3/4 percent created immediate analytical friction against forward guidance. This divergence forces traders to price in future hikes despite current policy inertia. The mechanism driving this volatility lies in the separation between the immediate voting outcome and the collective dot plot expectations. Such unanimity in current settings contrasts sharply with the aggressive trajectory implied by the updated median.
The cost of this mixed signaling is measurable volatility as algorithms react to conflicting data points. Operators must distinguish between the binding policy rate and the non-binding nature of individual staffer projections. Ignoring the gap between the held range and the projected path leads to premature position squaring. The tension resolves only when actual economic data forces the Committee to align the static range with its own forecasts.
Interpreting Economic Indicators for Forex Trading Strategies
Defining PCE, PMI, and ZEW Survey Metrics for CHF/USD

Thursday brings the May US Personal Consumption Expenditure Price Index, the primary inflation gauge steering rate expectations. This metric weights housing services differently than headline CPI, a distinction that directly shapes the federal funds rate trajectory. Large reporting dealers control 41% of daily volume, and their positioning shifts aggressively whenever PCE figures deviate from forecasts.
The Services PMI forecast of 51.0 suggests expansion, yet aluminum input costs surging 33% year-over-year distort margin realities for smaller firms. Swiss Franc volatility hinges on the ZEW Survey – Expectations data due Wednesday, which measures institutional sentiment rather than hard output. A divergence between US hard data and Swiss sentiment creates a policy gap that algorithms exploit instantly. Market depth remains fragmented, with non-reporting entities handling nearly a quarter of the $1.46 trillion daily flow, amplifying slippage during releases. Central banks increasingly deploy deep learning technology to anticipate these releases, narrowing the reaction window for manual traders. The cost of latency exceeds $25,000 per minute in missed arbitrage during high-volatility windows. Operators must distinguish between inflation gauges triggering policy changes and sentiment surveys reflecting future capital flows.
Executing CHF/USD Trades on June PMI and PCE Releases
Tuesday's session focuses on preliminary US S&P Global PMI data for June. The Services PMI is expected to arrive higher at 51.0, up from 50.7 in May. The Swiss Franc holds onto Monday's losses, trading around 0.8088 against the US Dollar as traders digest this forecast. A print matching the 51.0 expectation reinforces the narrative for tighter policy, pressuring the pair further below current levels.
Traders analyzing FOMC projections must reconcile the static target range with the hawkish shift in the median estimate for the federal funds rate at the end of 2026. This divergence creates a specific execution constraint. Buying the US Dollar on weak PMI data becomes hazardous if the ZEW Survey – Expectations data for June surprises to the upside on Wednesday. The cost of this strategy is exposure to whipsaw if the PCE data for May deviates from the inflation trajectory implied by the PMI. Unlike simple momentum trades, positioning here requires monitoring the gap between market pricing and the median projection held by policymakers. Failure to account for this disconnect leaves portfolios vulnerable to abrupt reversals when official statements lag market reality.
USD Strength Risks and DXY Resistance at 101.05
The US Dollar Index ticking higher to 101.05 creates immediate liquidation risk for short positions ignoring firm rate hike expectations. Traders attempting to fade this momentum face the massive daily forex volume, where liquidity shifts rapidly based on algorithmic reactions to FOMC projections. Ignoring the consensus for higher rates exposes capital to violent reversals driven by institutional rebalancing.
Steps for analyzing FOMC projections require isolating the median federal funds rate estimate from individual outlier dots to gauge true policy direction. Market depth concentrates heavily among reporting dealers who manage nearly half of North American flow, amplifying price moves when their hedges align with the median projection. A failure to account for this fragmentation leads to slippage during data releases like the Services PMI. The cost of misinterpreting these signals is magnified by the sheer scale of global trading volume, which dwarfs the capacity of retail order books to absorb shocks without significant price deviation. Unlike equity markets, forex lacks a central exchange, meaning price discovery occurs unevenly across fragmented venues. This structural opacity means that even correct directional bets on the Swiss Franc can fail if timing ignores the dominance of large dealer inventories.
Using the CME FedWatch Tool for Rate Probability Analysis
CME FedWatch Tool Probability Mechanics
The CME FedWatch tool derives rate hike odds by analyzing 30-Day Fed Funds futures prices rather than polling economist sentiment. This mechanism translates contract settlement values into actionable percentages, revealing market divergence from official policy stances.
- Access the institutional-grade data feed to view current month probabilities.
- Observe anchor non-FOMC months where contract prices operate independently, creating small discontinuities in the implied path.
- Compare the calculated probability against the static target range to identify pricing anomalies.
- Use the API access for automated integration into trading algorithms.
Programmatic data access allows monitoring of intraday probability shifts against the official stance. Execute hedges only when the divergence exceeds historical norms for similar projection cycles. The limitation is that Coverage Pillars users may face slippage during the initial repricing of this mismatch. Ignoring the gap between the maintained range and projected endpoint exposes capital to sudden liquidity evaporation.
About
Marcus Halloran, Chief Market Strategist at ForexCFD. Top, brings deep interbank expertise to this analysis of the Swiss Franc's decline against a surging US Dollar. Having previously served as an interbank FX strategist in London, Halloran specializes in decoding monetary policy shifts and interest-rate differentials that drive G10 currency pairs. His daily work involves translating complex Federal Reserve signals into actionable market insights, making him uniquely qualified to explain how firm rate hike bets are currently reshaping liquidity and price action. At ForexCFD. Top, an independent publication dedicated to vendor-neutral market news, Halloran applies this macro-focused lens to help retail traders navigate volatile sessions driven by central bank decisions. By connecting high-level FOMC expectations to real-time chart movements, he bridges the gap between institutional strategy and retail execution, ensuring readers understand the fundamental forces behind the USD's recent strength.
Conclusion
The structural friction between a static policy range and aggressive forward guidance creates a specific liquidity trap for algorithmic traders. As the balance sheet remains elevated near $6.7 trillion, the cost of holding hedged positions during these divergent signaling cycles erodes capital through premium decay rather than directional loss. Markets will eventually force a convergence, but the path involves violent volatility spikes that liquidate over-used accounts relying on lagging open-source indicators. You cannot afford to treat the current pause as stability when the median projection hints at a significantly higher terminal rate by mid-2026.
Adopt a conditional strategy that treats the current range as a temporary anomaly rather than a baseline. If the divergence between futures pricing and the official dot plot exceeds 40 basis points for more than three consecutive sessions, shift execution priority to direct exchange feeds immediately. This approach isolates you from the slippage plaguing retail-grade APIs during high-frequency repricing events. Do not wait for an official announcement to adjust your risk parameters; the market prices the expectation, not the event.
Start by auditing your current data latency this week. Compare your execution timestamps against raw CME data during the last FOMC speech to quantify your specific slippage exposure. If your delay exceeds 200 milliseconds, migrate your critical decision logic to a co-located server before the next projection update.
Frequently Asked Questions
Current projections indicate an 87% probability of rate increases within the year. This high likelihood reflects intense pressure from persistent inflation driving the Federal Reserve's aggressive monetary policy stance today.
The central bank holds a balance sheet of roughly $6.7 trillion in assets. This massive scale allows the institution to adjust the federal funds rate effectively to manage overall economic temperature conditions.
The FOMC recently voted to maintain the target range at 3.50% to 3.75%. However, market pricing currently diverges from this official hold, creating significant volatility for currency traders globally.
Historical records show transfers reaching $97.7 billion during surplus years. This figure illustrates the sheer scale of liquidity management possible under regimes utilizing quantitative easing or tightening policies effectively.
Some institutions now reduce assessment time by 75% using automated systems. This efficiency gain helps operators better analyze shifts between quantitative easing and tightening impacts on dollar value quickly.