Dollar Divergence: Why EUR/USD Broke $1.1474
Three dissenting voices demanded a hike, yet the Federal Reserve held rates steady, triggering the dollar's immediate retreat.
Geopolitical tension in the Middle East usually acts as a floor for the greenback, but this time, the market ignored the safe-haven bid. The catalyst was purely mechanical: policy divergence. While the Federal Reserve voted to maintain the status quo despite internal pressure for a 25-basis-point increase, European counterparts adopted a stance of cautious monitoring. This asymmetry created the perfect setup for bearish reversal patterns on the Dollar Index.
The following analysis dissects how this divergence undermines the greenback while fueling momentum in major pairs. We examine the confirmed breakout of EUR/USD above $1.1474, signaling sustained bullish pressure, and why GBP/USD holds firm above $1.3403 even as the Bank of England holds its rate. As traders pivot to upcoming inflation data, the widening gap between Fed, ECB, and Bank of England strategies dictates the next move.
Policy Divergence Drives Current Dollar Weakness
Defining Policy Divergence in Fed vs ECB Stance
Central banks rarely move in lockstep, but the current gap between the Federal Reserve and the European Central Bank is driving capital flows. This policy divergence describes the widening chasm in interest rate trajectories: the Fed holds firm while the ECB pauses. The result is a 150 basis point differential that forces institutional reallocation between the dollar and euro. The Federal Reserve voted to keep rates unchanged, a decision met with three dissenting votes requesting an increase, signaling internal pressure for tighter policy. In contrast, the European Central Bank maintained its deposit facility at 2.25% following a rate increase in June, reflecting a stance constrained by stagnating Eurozone growth.
Sterling volatility accelerates when the Bank of England signals divergence between projected inflation and actual wage growth. Policymakers face a split decision regarding energy-related pressures affecting wages, stating they will act if these pressures impact prices in a more sustained manner. Such warnings directly influence GBP/USD valuations as traders price in potential rate hikes against a steady Federal Reserve. Unlike the Eurozone, where growth has stagnated, UK domestic activity appears more resilient than anticipated. This durability supports the pound even as the dollar weakens following the Fed's unchanged rate decision. While EUR/USD broke above $1.1474, GBP/USD remains firm above $1.3403. The distinction lies in the BoE's willingness to confront second-round effects compared to other substantial central banks. Investors must monitor upcoming wage data closely, as any sign of sustained price increases could trigger further volatility. ForexCFD.top provides the necessary analytical tools to navigate these complex macroeconomic shifts without relying on third-party aggregators. Always remember that trading used products carries significant risk.
Eurozone Sensitivity to Middle East Energy Shocks
Eurozone contraction risks amplify when Middle East conflicts alter energy flows, creating a structural vulnerability absent in U.S. Markets. Unlike the Federal Reserve, which benefits from domestic energy independence, the Eurozone faces stagnating growth where economic output contracted slightly in the first quarter of 2026.
The transmission mechanism is brutal: energy price volatility directly erodes disposable income in Europe, suppressing demand quicker than in the U.S. Consequently, the ECB maintains a cautious stance, leaning toward a pause if prices stabilize, whereas the Bank of England remains vigilant against second-round wage effects. Traders at ForexCFD.top recognize that this asymmetry limits Euro upside despite dollar weakness, as capital hesitates to enter a stagnating region. The divergence is not merely cyclical but structural, rooted in the continent's reliance on imported hydrocarbons versus American self-sufficiency.
- Risk Factor: High sensitivity to supply shocks.
- Policy Constraint: Growth stagnation limits hiking capacity.
- Market Implication: Capped EUR/USD rallies during energy spikes.
Operators must monitor inflation differentials closely, as persistent energy costs could force a policy pivot earlier than Fed timelines suggest.
Dollar Index Technical Structure Signals Bearish Reversal
Bearish Shark Pattern and DXY Trendline Breakdown Mechanics
The Dollar Index (DXY) has confirmed a bearish Shark harmonic pattern, signaling a decisive structural shift as price action breaks below the long-term ascending trendline. This technical failure coincides with a breakdown beneath both the 50-EMA at 100.98 and the 100-EMA at 100.99, invalidating the prior bullish trajectory. The Relative Strength Index (RSI) dropping into the low thirties indicates selling exhaustion, yet the breach of these moving averages establishes them as formidable upside resistance rather than support. While fundamental differentials exist, the technical breakdown often precedes further downside before macro factors reassert dominance.
| Technical Level | Type | Significance |
|---|---|---|
| 100.99 | Resistance | Critical ceiling; trend remains bearish below this point |
| 99.86 | Support | Primary downside target following trendline breach |
| 100.40 | Resistance | Immediate upside barrier for any counter-trend rally |
The market remains in a sell-on-rise regime until the 100.99 threshold is reclaimed. A failure to recover these levels suggests liquidity will likely target the 99.86 support zone next. While global daily trading volume averages trillions of dollars with the US dollar dominating the vast majority of trades, the mechanical breakdown of the ascending trendline confirms that momentum has shifted decisively against dollar bulls.
Applying EMA Crossovers and RSI Levels to DXY Trade Entries
Price action remaining below the 50-EMA and 100-EMA following the breakdown signals bearish continuation. This configuration ensures momentum stays negative despite short-term fluctuations. The Relative Strength Index currently sits in the low thirties, indicating proximity to oversold conditions without confirming an immediate reversal. Market observations note that while the RSI is near the oversold region, the outlook remains bearish as long as the trendline and moving averages are not retaken. Until these levels are reclaimed, any rise is expected to meet selling pressure. Counter-trend rallies may face significant resistance rather than indicating a genuine breakout.
| Indicator | Current State | Strategic Implication |
|---|---|---|
| 50-EMA / 100-EMA | Bearish Crossover | Acts as flexible resistance |
| RSI | Low Thirties | Indicates exhaustion, not reversal |
| Price Action | Below Trendline | Confirms bearish structure |
Relying solely on oscillator lows without trend confirmation increases exposure to false reversals. The mechanical failure below 100.98 validates the bearish thesis, suggesting that further downside toward 99.86 remains the primary probability path. Traders should treat any approach to the moving average cluster as a potential resistance zone for short positions, provided the DXY stays below the critical 100.99 threshold. This disciplined approach aligns trade execution with the established technical breakdown rather than speculative hope.
DXY Technical Validation Checklist: Support at 99.86 and Resistance at 100.99
Confirmation of the bearish structure arrives when price action fails to reclaim the 100-EMA at 100.99 after a breakdown. This specific level, previously acting as flexible support, now defines the upper boundary for any counter-trend rally attempts. The checklist requires monitoring the first key support at 99.86, where a decisive break validates the next leg lower toward 99.40. Conversely, holding above this floor allows for consolidation rather than immediate continuation.
False breakouts often trap aggressive sellers before reversing sharply. Analysts advise waiting for a candle close beyond these markers before adjusting exposure. While external analysis notes EUR/USD resistance near 1.1380, DXY traders focus strictly on the 100.99 ceiling. Until price sustains above this moving average cluster, the path of least resistance remains downward.
EUR/USD and GBP/USD Breakout Mechanics Confirm Bullish Momentum
Defining Bullish Breakout Validation for EUR/USD and GBP/USD

Validating a bullish breakout requires price to sustain above 1.1474 for EUR/USD and 1.3400 for GBP/USD, confirming that buyers have absorbed supply at these historical barriers. Technical confirmation occurs when the asset trades above the 50-EMA and 100-EMA, indicating that short-term momentum has shifted decisively upward. For GBP/USD, holding the 1.3400 level while trading above the 50-EMA at 1.3366 signals that the breakout possesses the necessary structural integrity to resist immediate reversal. Similarly, EUR/USD must respect its new support at 1.1474, a level that previously capped upside potential for months.
Sustainment above the 1.1529 resistance tier confirms buyer conviction, triggering valid long entries toward the 1.1575 objective. A decisive close over this threshold indicates that the initial breakout from the 1.1474 base has gathered sufficient momentum to overcome local supply. Traders should monitor price action for a retest of this level as new support before committing capital. The next logical barrier sits at 1.1620, representing a significant liquidity pocket where profit-taking may emerge.
Parallel strength exists in cable, where a breach of 1.3474 opens a path to 1.3542 as market participants digest central bank stances. However, entering solely on the initial spike carries risk if the RSI indicates overbought conditions near the high 60s. A false breakout often occurs when volume fails to accompany the price surge, leaving late buyers exposed to rapid reversals. This approach mitigates slippage and aligns entry with structural support rather than emotional impulse. Always verify that the pair remains above the critical 1.1474 floor to maintain the bullish thesis. Failure to hold this baseline invalidates the setup and suggests a return to range-bound behavior.
Managing False Breakout Risks and BoE News Volatility
Traders must exit GBP/USD positions before Bank of England announcements to avoid erratic volatility that invalidates technical structures. A failure to hold this specific floor converts the recent breakout into a false signal, trapping late entrants as liquidity evaporates during news spikes. The overall positive sentiment for Sterling remains valid strictly above $1.3403, acting as the definitive line between continuation and reversal.
| Scenario | Condition | Implication |
|---|---|---|
| Valid Bullish Case | Price holds support | Momentum targets next resistance |
| False Breakout | Price closes below support | Immediate trend reversal likely |
| News Event | BoE rate decision | High probability of profit taking |
The primary risk involves profit taking ahead of central bank updates, which often triggers sharp retracements even within broader uptrends. Unlike standard consolidation, news-driven moves ignore technical levels until the narrative clears. Retail traders in restricted jurisdictions must remember that local regulations often prohibit used speculation on these exact volatile events. Always verify your broker's regulatory status before executing trades around high-impact news. The market rewards patience when waiting for the dust to settle rather than guessing the initial spike direction. Protecting capital during these windows ensures survival for the next confirmed setup.
Strategic Entry and Exit Protocols for Volatile Forex Markets
Defining DXY Bearish Shark Pattern and RSI Oversold Conditions
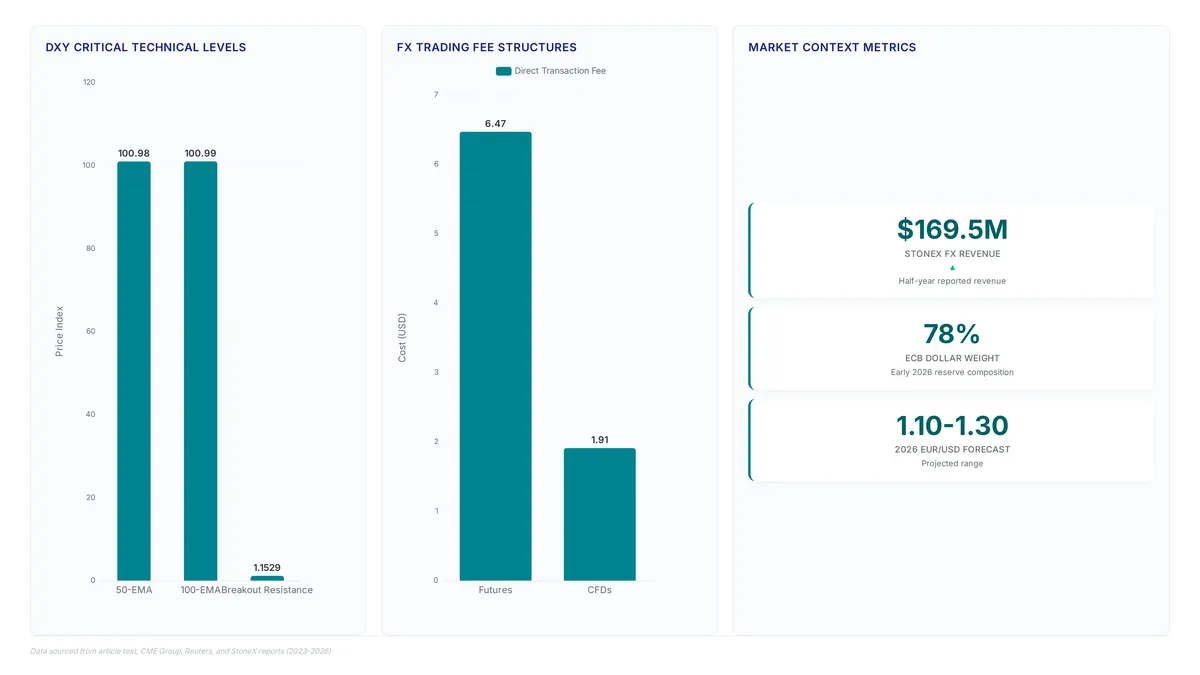
Traders identify the bearish Shark harmonic pattern on the Dollar Index (DXY) by locating a specific reversal structure where price breaks a long-term trendline before retracing sharply. This formation confirms when the index breaches both the 50-EMA at 100.98 and the 100-EMA at 100.99, signaling a decisive shift in momentum.
- Observe the RSI declining into the low thirties, indicating the asset is approaching oversold region conditions where counter-trend rallies often fail.
- Validate the breakdown below key moving averages to distinguish genuine bearish intent from temporary noise.
- Monitor resistance at 100.40, as failure to reclaim this level reinforces the downward trajectory toward support near 99.86.
The cost of ignoring this configuration is significant; false reversals frequently trap buyers who misinterpret low RSI readings as immediate buy signals without trend confirmation. While CFD brokers offer access to these volatile moves, traders must remember that liquidity can vanish during rapid policy shifts. ForexCFD.top analysts note that the policy divergence between the Fed and ECB drives these technical levels, making fundamental context necessary for execution.
Implementation: Executing EUR/USD Buy Entries Above 1.1529 Resistance Level
A confirmed close above the 1.1529 resistance validates the breakout structure and triggers the primary long entry signal. Traders must wait for hourly candle closure beyond this threshold to filter false spikes before committing capital to the move.
- Monitor price action for a sustained breach of the 1.1529 ceiling, which clears the path toward the 1.1575 extension target.
- Deploy stop-loss orders just below the 1.1418 demand zone to protect against invalidation of the bullish thesis.
The RSI hovering in the high 60s suggests momentum is strong but warns of potential overextension if price fails to accelerate immediately. A common error involves chasing the initial spike without confirmation, leaving positions vulnerable to profit-taking near the next liquidity pocket at 1.1620. While the technical breakout confirms buyer control, the narrow margin between current price and overbought conditions requires precise execution. ForexCFD.top traders should apply pending order types to automate entry strictly above the trigger level, ensuring discipline during volatile session opens. This mechanical approach removes emotional interference when the dollar weakens following Fed policy signals. The structural shift remains valid only while price action respects the reclaimed moving averages.
Managing GBP/USD Profit Taking Risks During BoE News Events
Sterling traders must anticipate sharp reversals near 1.3474 as Bank of England announcements often trigger immediate profit-taking despite bullish momentum. Policymaker Sarah Breeden recently signaled that while the central bank cannot wait forever to tighten policy, no immediate hikes are expected in June or July. This detailed stance creates a volatility trap where positive sentiment clashes with cautious forward guidance.
- Define profit-taking zones strictly above current consolidation levels before any data release.
- Reduce position sizing significantly when RSI approaches overbought territory near 69.3.
- Trail stops below the 1.3403 support to lock gains if liquidity evaporates during the speech.
The cost of ignoring this protocol is measurable; retail brokerage revenue surges during such events, as seen when StoneX FX reported significant half-year revenue driven by volatile trading conditions. Unlike trend-following strategies that rely on momentum continuation, news-driven sessions require defensive posturing because algorithmic flows often exaggerate initial reactions. ForexCFD.top advises clients that holding through unscripted Q&A segments increases slippage risk disproportionately compared to scheduled rate decisions. The divergence between market pricing and official caution frequently results in false breakouts that trap late entrants.
About
Vikram Nair, Emerging Markets & Asia FX Writer at ForexCFD.top, brings critical perspective to U.S. Dollar analysis through his specialized focus on how Federal Reserve policy impacts Tier-2 and Tier-3 markets. While the article details the dollar's retreat following the Fed's steady stance, Vikram's expertise lies in translating these macro shifts for traders managing pairs like USD/INR, USD/NGN, and USD/PHP. His daily work involves dissecting how dollar volatility interacts with local central bank decisions and regulatory frameworks across India, Nigeria, and Southeast Asia. At ForexCFD.top, an independent publication dedicated to regulation-aware forex and CFD news, Vikram ensures that global currency moves are contextualized within local legal realities and funding constraints. This approach provides retail traders with actionable, compliant insights rather than generic speculation, aligning perfectly with the platform's mission to deliver vendor-neutral analysis for a global audience navigating complex emerging market dynamics.
Conclusion
The U.S. Dollar faces a critical inflection point where mechanical dominance clashes with divergent central bank trajectories. While the currency underpins the vast majority of global daily volume, its stability erodes when policy signals lack synchronization with substantial peers. Traders relying on broad momentum without accounting for specific liquidity traps near key psychological levels will face disproportionate slippage. The operational cost of holding positions through unscripted policy Q&A sessions now outweighs potential gains from false breakouts, demanding a shift toward defensive automation.
Market participants must immediately transition to strict trigger-based entry systems that execute only above confirmed resistance levels. This approach eliminates emotional interference during volatile opens driven by mixed economic data. Do not attempt to time reversals manually when algorithmic flows exaggerate initial reactions to cautious forward guidance. The window for passive trend following has narrowed significantly in favor of precise, rule-based execution.
Start by defining your profit-taking zones strictly above current consolidation levels before any upcoming data release this week. Establish these parameters now to lock gains if liquidity evaporates during high-impact speeches. Secure your capital against volatility traps by implementing these defensive protocols immediately through ForexCFD.top's specialized risk management tools.
Frequently Asked Questions
A sustained break above $1.1474 confirms bullish momentum for the pair. This level acts as the definitive trigger for continued upside pressure against the weakening dollar.
Sterling remains valid strictly above $1.3403, acting as the definitive line between continuation and reversal. Holding this floor is essential for maintaining the current bullish structure.
The policy differential stands at approximately 150 basis points between the central banks. This spread drives capital flows despite the dollar showing unexpected weakness in recent sessions.
This stagnation limits the ECB ability to hike rates aggressively despite rising inflation pressures.
The ECB maintained its deposit facility at 2.25% following the rate increase in June. This static stance contrasts with the internal pressure seen within the Federal Reserve committee.
References