Inflation Rise: Why Services Costs Stall Fed
US inflation hit 4.2% in May 2026. Chicago Fed President Austan Goolsbee calls the trajectory "wrong." The central bank stands at an inflection point. Persistent services inflation demands a policy reevaluation even as the labor market holds firm. Goolsbee warns that inflation rates remain stuck well above the 2% target. The driver is a disturbing rise in services excluding energy, compounded by a massive sharp surge in energy costs reported by April 2026.
Inside the FOMC, non-voting presidents like Goolsbee still shape the debate. Their focus lands squarely on transportation and medical care sectors pressuring the broader economy. The strategic response? A shift toward reduced forward guidance. Goolsbee supports this move to stop markets from overreacting to every linguistic nuance. With iShares data showing mixed employment signals keeping the Fed in review mode through 2026, the path forward requires distinguishing temporary shocks from entrenched price increases without triggering a demand collapse.
Goolsbee's Inflation Assessment and the Divergence from Target
Goolsbee's Warning on Services Inflation Divergence
Austan Goolsbee flagged services inflation as "particularly concerning." The 4.2% rate in May 2026 sits far above the 2% target. The Chicago Federal Reserve president emphasized that price pressures are moving the wrong way, specifically within services rather than goods. core PCE surged to 4.4% in early 2026. This complicates the distinction between temporary shocks and persistent trends. Unlike broad consumer indices, services pricing reflects sticky labor costs that resist rapid adjustment.
Data ambiguity keeps the central bank in review mode, preventing clear forward guidance on rate cuts. Operators must recognize that a modest core rate masks deeper structural issues in non-energy services. When the Fed abandons forward guidance due to data ambiguity, borrowing costs become volatile. Network engineering budgets relying on stable interest rate assumptions face immediate repricing risk. Waiting for "hard evidence" of persistence allows inflation to entrench further. Goolsbee's assessment signals a shift toward reactive policy rather than preemptive adjustment. This approach increases uncertainty for long-term infrastructure projects dependent on steady financing conditions.
This metric isolates price pressures that exclude volatile food and energy components, yet the current surge contradicts the expectation of cooling demand. The three-month annualized pace indicates a re-acceleration rather than a plateau. Operators must note that while headline numbers attract attention, the underlying core inflation trajectory drives long-term policy shifts more than temporary spikes. Energy costs complicate this picture by jumping significantly annually, creating a divergence between input costs and final consumer pricing. Such volatility often masks the stickiness of services inflation, which remains the primary concern for the Federal Reserve.
| Metric | Trend Direction | Policy Implication |
|---|---|---|
| Core PCE | Accelerating | Delays rate cuts |
| Energy Costs | Volatile Spike | Transitory impact likely |
| Services Index | Sticky High | Requires demand cooling |
Energy cost data tends to revert quickly, potentially misleading forecasts if weighted too heavily against core measures. A premature pivot to easing based on falling oil prices would ignore the entrenched nature of services pricing. Policymakers face a tension between reacting to immediate pain and anchoring long-term expectations. Ignoring the divergence between volatile energy inputs and sticky core output risks a second-wave inflation event. The cost of misinterpretation is a loss of credibility that requires aggressive tightening to restore.
Persistent Inflation Versus Transitory Shock Dynamics
Persistent inflation embeds itself in long-term contracts. This differs sharply from transitory shocks or the temporary spikes seen in classic stagflation scenarios. Current data shows inflation for services excluding energy stood at a modest level, a figure that resists the rapid decay typical of supply-chain interruptions. Such infrastructure cost pressures create a feedback loop absent in pure demand shocks. Financial markets have remained stable following the event, suggesting investors distinguish between these persistent drivers and temporary noise.
However, the divergence between stable asset prices and rising input costs creates a tension for monetary policy. Relying on historical transitory models fails when electricity prices drive broad-based increases. Treating structural cost pushes as temporary delays necessary rate adjustments. Operators must recognize that without a demand collapse, this environment lacks the defining contraction of stagflation.
FOMC Voting Dynamics and the Mechanics of Non-Voting Influence
FOMC Voting Rotation and Non-Voting Member Status
Goolsbee holds no the vote this year. The FOMC structure limits active ballots to a rotating subset of five regional presidents. All 12 regional Fed presidents participate in deliberations regardless of status, yet only the active voters determine the policy outcome recorded in the June 17, 2026 directive. This arrangement creates a structural asymmetry where non-voting members influence discourse without altering the immediate decision matrix. The mechanism relies on consensus building rather than raw vote counting during the discussion phase. Market algorithms often discount commentary from non-voting members until their rotation cycle returns. Non-voting dissent carries less weight in probability models than the unified front of the voting bloc.
Internal divergence remains significant, with some participants projecting a longer-run rate as high as 3.875% while others target lower thresholds. Such a wide spread in forecasts indicates that the single policy rate masks substantial disagreement within the committee. This fragmentation complicates the interpretation of public statements from non-voting presidents like Goolsbee. Their views reflect regional economic conditions but lack the binding authority of the final vote. Network engineers modeling capital costs must prioritize the median projection over outlier comments from non-voting seats. Misinterpreting this distinction leads to an inaccurate assessment of the federal funds trajectory.
Market Interpretation of Goolsbee's Non-Voting Commentary
Trading desks discount non-voting remarks relative to Warsh or active voters, creating a signal-to-noise filtering problem during rate discovery. Participants monitor these comments for framing clues rather than binding policy signals. The FOMC maintained the federal funds target range at 3.5%–3.75% on June 17, 2026, yet internal divergence remains acute. This spread forces traders to parse Goolsbee's language for alignment with either extreme.
Algorithms often underweight non-voting sentiment until it aligns with the median forecast. Ignoring regional presidents risks missing early shifts in the consensus before they appear in the dot plot. Persistent services inflation complicates this analysis by blurring the line between transitory shocks and entrenched trends. Operators must distinguish whether Goolsbee's focus on services reflects a temporary data anomaly or a structural change in pricing power. Misinterpreting this distinction results in a misplaced bet on the timing of the next rate move. Market polarization intensifies this challenge as investors struggle to reconcile uneven monetary policy with AI-driven sector growth.
Validating Influence Through Deliberation Participation
Non-voting FOMC members exert influence by shaping the consensus range during internal debates rather than casting ballots. All regional presidents participate in FOMC deliberations regardless of rotation status, ensuring their views on services inflation enter the official record. This mechanism allows a non-voting member like Goolsbee to sway the median forecast even without the vote. Market algorithms frequently discount these contributions relative to voting members, creating a signal-processing lag. Researchers now apply generative AI to meeting minutes to quantify this non-voting impact, though early models struggle with categorization errors. Operators rely on qualitative parsing of Goolsbee's statements to detect shifts before the June median forecast updates. Markets must distinguish between a lack of voting power and a lack of persuasive authority within the committee. This distinction drives alpha in rate-sensitive assets where consensus builds slowly.
Strategic Shift to Reduced Forward Guidance and Clearer Signals
Defining the Shift from Forward Guidance to Less-Is-More Fed Communication
Traditional forward guidance relied on explicit rate path forecasts, a practice Goolsbee now critiques by aligning with Warsh's preference for reduced verbal intervention. After 15 years of market participants dissecting every syllable, the argument suggests that a Fed that talks less may actually stabilize expectations rather than confuse them. This strategic pivot addresses the noise created when central bankers speculate frequently on future rates, a habit that often clashes with data-dependent realities.
| Dimension | Forward Guidance Era | Less-Is-More Strategy |
|---|---|---|
| Signal Clarity | High frequency, low specificity | Low frequency, high reliance on data |
| Market Reaction | Volatile over-interpreting of hints | Stabilized by absence of speculation |
| Policy Flexibility | Constrained by prior verbal commitments | Unencumbered by previous rate hints |
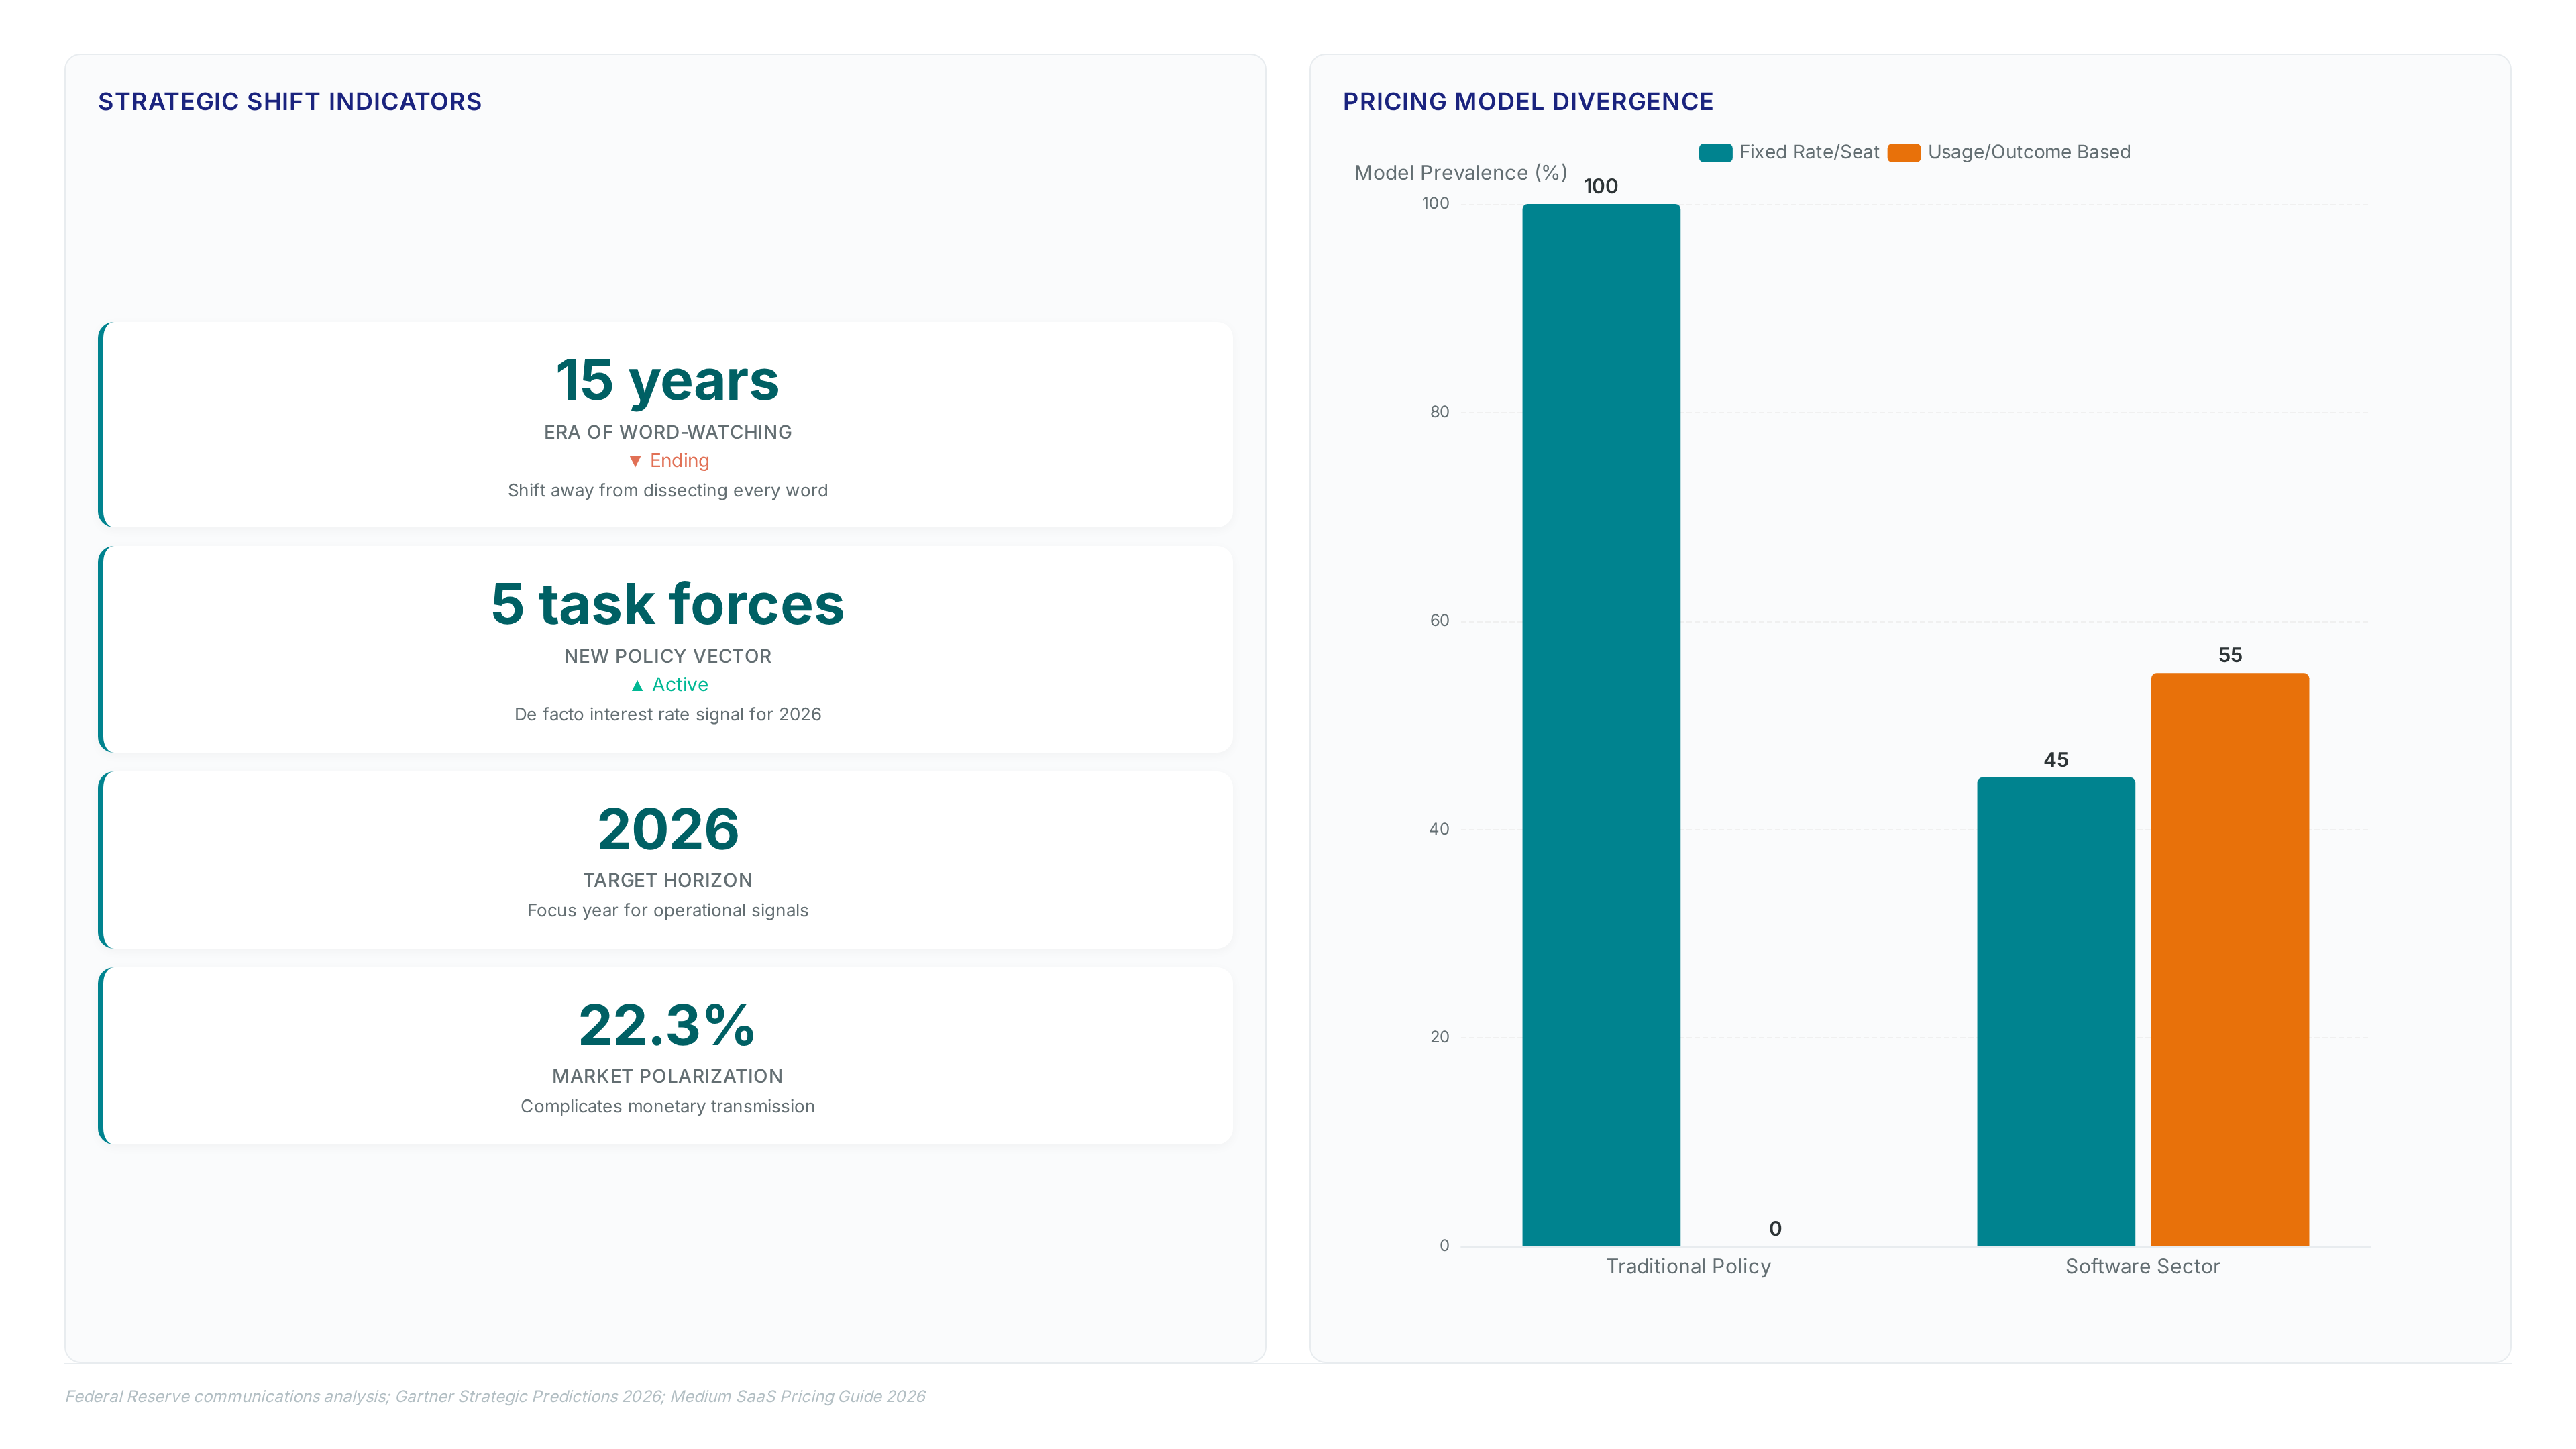
The shift coincides with a period where market polarization complicates the transmission of monetary signals across different sectors. Unlike the fixed-rate nature of traditional policy instruments, modern pricing strategies in the private sector have moved toward usage-based metrics, demanding more agile central bank communication. The limitation of this quieter approach is that it removes the soft guardrails markets used to price risk, forcing traders to rely solely on hard inflation prints. Consequently, the communication style evolves from guiding expectations to merely reporting observed economic conditions.
Interpreting Fed Statements Under Warsh's Task Force Overhaul
Market participants must decode operational shifts rather than dot plot averages now that Kevin Warsh opted out of personal rate forecasts in the June dot plot. This silence forces a reliance on the newly announced five task forces tasked with overhauling Federal Reserve operations. The mechanism prioritizes structural reform signals over explicit forward guidance, demanding analysts track administrative appointments instead of interest rate projections. However, this opacity introduces latency in market pricing, as traders struggle to quantify the inflation impact of bureaucratic reorganization without clear numerical targets.
| Dimension | Forward Guidance Era | Task Force Regime |
|---|---|---|
| Primary Signal | Dot plot median | Operational mandate scope |
| Update Frequency | Quarterly | Ad-hoc during reforms |
| Volatility Driver | Deviation from forecast | Task force composition |
| Data Dependency | Low (preset path) | Extreme (reactive) |
The divergence between fixed monetary instruments and variable economic reality complicates this transition, especially as software firms shift to usage-based models. Unlike the predictable forward guidance of the past, the current framework requires interpreting the scope of five task forces as the new policy vector. The limitation is acute: without explicit rate paths, markets may misinterpret administrative delays as policy shifts. Consequently, traders should weight staffing announcements heavily, treating the composition of these operational groups as the de facto interest rate signal for 2026.
Traditional Word-Watching Versus the New Silence on Rate Speculation
Meanwhile, the era of parsing every syllable for rate cues ends as the Fed adopts a data-dependent silence that forces reliance on structural signals. Goolsbee's alignment with Warsh marks a departure from 15 years of word-watching, shifting analysis toward operational overhauls rather than verbal forecasts. This change requires investors to monitor task forces instead of dot plots, as explicit guidance vanishes from public discourse.
| Dimension | Word-Watching Era | New Silence Framework |
|---|---|---|
| Primary Signal | Verbal rate speculation | Operational task force output |
| Market Reaction | High frequency noise | Latency in price discovery |
| Analyst Focus | Syllable counting | Infrastructure metric shifts |
The limitation of this approach is visible in software, where firms shift to usage-based pricing. Divergent inflation metrics complicate this transition; while the central bank tracks CPI and PCE, the gap creates ambiguity that verbal cues previously smoothed. Markets now face a signal-to-noise inversion where less talking generates more volatility initially. Private analysts focusing on talent procurement may miss the monetary policy impact hidden in these structural shifts. The cost is measurable: traders must now decode bureaucratic appointments to gauge inflation framing. This opacity delays reaction times until hard data confirms the trend. Reduced commentary removes the safety net of forward guidance, exposing portfolios to sharper repricing events when data diverges from silent expectations.
Applying Fed Signals to Investment Strategy and Rate Expectations
Application: Defining the Structural Divergence Between Services and SaaS Inflation
Aggregate CPI metrics mask a severe cost disconnect where general price increases lag behind specific digital infrastructure expenses. While broader services inflation remains elevated, enterprise software costs have accelerated to a point where SaaS spending now consumes $1 of every $8 in typical organizational budgets. This disparity creates a hidden liability for portfolios heavily weighted toward technology-dependent business models that cannot pass through SaaS inflation at the same velocity as vendors raise prices.

The structural divergence stems from distinct pricing mechanisms between labor-intensive services and license-based software contracts. General inflation data fails to capture how modern enterprise architecture relies on microservices that multiply API calls and associated usage fees independently of headcount. Investors analyzing central bank communications must therefore decouple consumer price signals from industrial input costs.
| Metric Category | Price Driver | Portfolio Impact |
|---|---|---|
| Services Inflation | Labor tightness | Moderate margin compression |
| SaaS Inflation | Vendor consolidation | Acute cash flow erosion |
Relying solely on Federal Reserve commentary regarding consumer prices ignores the localized deflationary pressure high software costs exert on corporate capital expenditure. The limitation of this approach is that monetary policy tools cannot directly address supply-side concentration in the software market. Ignoring this variance leads to mispriced risk assets where revenue growth assumptions fail to account for escalating fixed operational overhead.
Application: Adjusting Portfolios Using Goolsbee's Services Inflation Warning
Portfolio adjustments must prioritize sectors with pricing power as Goolsbee confirms inflation heads the wrong direction. The mechanism for transmission involves labor-intensive industries passing costs to consumers, unlike goods sectors where efficiency gains often absorb shocks. However, Goolsbee expressed sympathy with Chair Warsh's reduced forward guidance, creating ambiguity on the timing of any pivot. This silence forces reliance on hard data rather than verbal cues from Chicago Federal Reserve officials.
The implication for asset allocation is a rotation away from duration-sensitive growth stocks toward value instruments with immediate cash flow. With the 12-month inflation rate elevated, bonds offer limited real yield protection despite nominal rate stability. This divergence suggests technology-heavy portfolios face margin compression unrelated to broad monetary tightening. Operators should monitor Philip Jefferson speeches for labor market signals that might validate Goolsbee's stagflation concerns. The cost of inaction is measurable erosion of real returns in fixed-income baskets. Investors must distinguish between transitory energy spikes and persistent service sector heat. Failure to differentiate these drivers leads to mispriced risk in both equity and debt tranches.
Hidden Cost Risks from Rising SaaS Prices and Extended Sales Cycles
Corporate earnings face immediate erosion as enterprise sales cycles extend by 23 days, delaying revenue recognition while fixed costs accumulate. This lag creates a cash flow mismatch that aggregate inflation models frequently miss when projecting tech sector health. The mechanism driving this pressure involves Customer Acquisition Costs Vendors pass their own input costs directly to buyers, creating a compounding effect on operating expenses. The limitation for investors is that standard hedging strategies against general price increases fail to address this specific vertical compression. Equity valuations in the technology sector remain vulnerable because reduced forward guidance from the Fed leaves little room for error in earnings reports. Portfolios heavy in growth stocks must account for this structural margin squeeze rather than relying solely on macro rate expectations.
About
Sofia Mendes serves as the Broker Reviews & Trading Education Editor at ForexCFD. Top, where she oversees rigorous broker due diligence and trading education. Her daily work evaluating regulatory compliance and execution quality makes her uniquely qualified to analyze inflation's impact on currency markets. As central bank decisions regarding interest rates directly dictate FX volatility and CFD pricing, Sofia's expertise in macroeconomic drivers allows her to translate complex data, such as the Fed's stance on rising services inflation, into actionable insights for traders. At ForexCFD. Top, an independent publication dedicated to vendor-neutral market analysis, she connects high-level monetary policy to practical risk management strategies. By monitoring how inflation metrics influence gold, majors, and emerging market pairs, Sofia ensures the global retail trading community understands the tangible consequences of economic shifts on their portfolios without hype or bias.
Conclusion
The real breaking point for technology operators in mid-2026 is not the headline rate itself, but the structural rigidity of service costs that refuse to normalize alongside goods. While monetary policy attempts to cool aggregate demand, the specific inflation of enterprise software and extended sales cycles creates a compounding cash flow mismatch that standard hedging instruments cannot touch. This environment punishes companies relying on future revenue recognition while their immediate operating expenses surge. The window for passive capital allocation has closed; survival now demands active restructuring of vendor contracts and a ruthless audit of customer acquisition efficiency.
Executives must adopt a defensive liquidity posture immediately, assuming high borrowing costs will persist through 2027 rather than betting on imminent Fed relief. Instead, treat the current elevated environment as the permanent baseline for strategic planning.
Start by auditing all SaaS renewals scheduled for the next quarter this week to identify price hikes exceeding a modest threshold and negotiate fixed-rate multi-year terms before vendors adjust pricing models again. This single action locks in predictable costs and insulates your burn rate from the very inflation metrics eroding your real returns.
Frequently Asked Questions
Services inflation resists rapid decay unlike volatile energy spikes. Data shows services excluding energy stood at 3%, creating persistent pressure that compels the Federal Reserve to maintain restrictive policies despite falling oil prices elsewhere.
The current inflation rate significantly exceeds the official goal. In May 2026, the rate hit 4.2%, which is more than double the Federal Reserve's strict 2% target, prompting urgent reassessment of monetary policy directions.
A specific core metric reveals hidden economic pressures. Operators must recognize that a 2.6% core rate masks deeper structural issues in non-energy services, indicating that surface-level improvements do not reflect underlying price stickiness.
Massive energy surges create misleading volatility in headline data. Costs jumped 17.9% annually, creating a divergence between input costs and final consumer pricing that complicates the distinction between temporary shocks and persistent trends.
Accelerating core measures delay any potential relief for borrowers. Core PCE surged to 4.4% in early 2026, complicating the distinction between temporary shocks and persistent trends while forcing the central bank to remain in review mode.