USD CNY Rate: How the 0115 GMT Fix Moves Markets
At 0115 GMT, the People's Bank of China (PBOC) publishes a single number that anchors a $9.6 trillion market. This isn't a passive market clearing price; it is a deliberate policy lever. Beijing uses this daily ritual to signal its tolerance for currency fluctuation within a strict 2% trading band. While global FX volumes reported by the Bank for International Settlements reach $9.6 trillion, China's managed floating system relies entirely on this discretionary midpoint to balance domestic stability against external pressure.
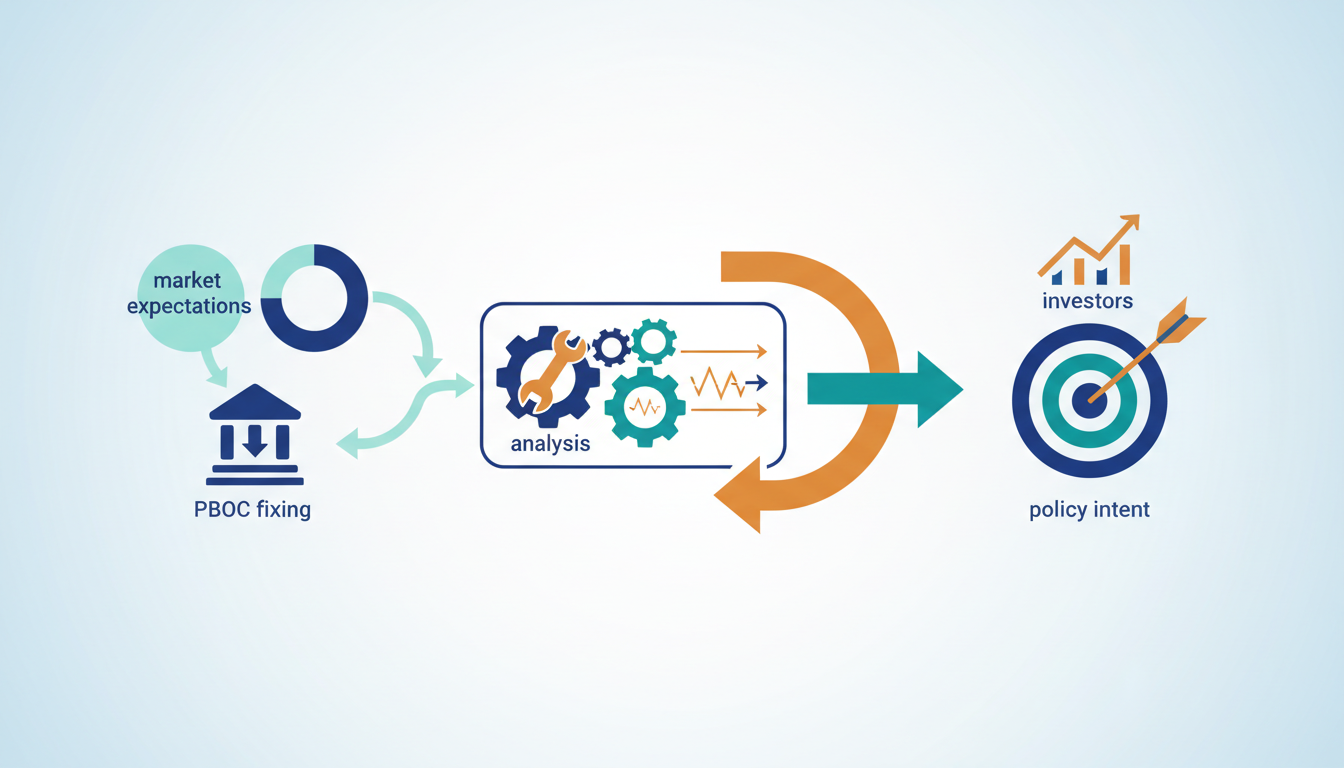
We need to dissect the architecture of this midpoint mechanism and contrast it with free-floating regimes where market forces dictate price without central guardrails. The PBOC synthesizes previous closing prices, international FX conditions, and capital flow data to engineer the daily fix. Unlike the algorithmic executions predicted by Gartner for 2028, this process retains human discretion to guide market expectations explicitly. (Gartner's strategic predictions for 2026)
The strategic value lies in decoding fixing signals to forecast Beijing's next move during volatility. A stronger-than-expected CNY midpoint indicates a stance against depreciation, while a weaker fix suggests acquiescence to dollar strength. Understanding these nuances is critical because the reference rate serves as the primary transmission channel for China's broader financial stability objectives, not a simple reflection of supply and demand.
The Role of the Midpoint in China's Managed Floating Exchange Rate System
Defining the PBOC Daily USD/CNY Midpoint Fixing
China adopted its current managed floating exchange rate framework on January 1, 1994, establishing a daily reference price instead of a rigid peg. This midpoint serves as the gravitational center for the renminbi, permitting market forces to operate only within a strict ±2% trading band during onshore hours.
Unlike the US Dollar or Euro, where rates float freely, the People's Bank of China actively intervenes to guide direction and reduce volatility. A strong CNY fixing signals resistance against depreciation, while a weak midpoint indicates tolerance for softness amid dollar strength. The band provides liquidity, yet the discretionary midpoint setting allows regulators to override pure market pricing. Operators recognize that the published rate reflects policy intent as much as supply and demand.
Latency sensitivity peaks around the 0115 GMT release window for networked trading systems. Algorithms parsing the USD/CNY fix must account for sudden liquidity shifts if the value deviates from consensus. Market makers adjust limits instantly, creating micro-volatility that automated hedges must absorb. Failure to align execution logic with the PBOC's signaling results in slippage. The system prioritizes stability over price discovery efficiency.
Tracking the 0115 GMT PBOC Reference Rate Release
Regulators set the daily USD/CNY reference rate at 0115 GMT, a timestamp serving as the primary policy signal for Asian FX markets. This fixing establishes the central axis for the renminbi, determining the boundaries within which market forces operate during onshore hours. A weaker midpoint indicates tolerance for CNY depreciation, often aligning with domestic growth objectives or responding to external dollar strength.
Active management reduces volatility and guides expectations within China's system, unlike free-floating regimes where intervention remains rare. The lack of transparency surrounding these calculations distinguishes the People's Bank of China from counterparts managing the US Dollar or Euro. Traders monitor the 0115 GMT release closely because it reveals whether regulators prioritize export competitiveness or capital stability.
Global daily FX trading volume reached $9.6 trillion, making this single reference point critical for liquidity conditions. The sheer scale means even minor deviations in the fixing can trigger substantial capital flows across the region. Market participants interpret the level not merely as a price but as a discretionary tool for macroeconomic steering.
Managed Float Intervention vs Free-Floating USD and Euro
Active central bank participation steers value under a managed floating exchange rate, contrasting sharply with free-floating regimes where market forces dominate. The People's Bank of China regularly intervenes to reduce volatility, whereas intervention in pure float systems remains rare and reserved for extraordinary circumstances.
America alone, gross volume approaches $1.46 trillion, F-correct without official price targeting. The Bank of Canada This differs from the onshore yuan, which faces hard constraints within its trading band. This divergence creates a specific operational tension where regulators must balance export competitiveness against capital flight risks using the same policy lever. A stronger midpoint signals resistance to depreciation, while a weaker fixing tolerates softness. Unlike free-floating currencies where the exchange rate absorbs external shocks automatically, the managed system forces the central bank to absorb pressure directly through reserves or liquidity adjustments. This mechanism transforms the currency rate from a market signal into a deliberate policy tool.
Inside the PBOC Fixing Mechanism and Trading Band Architecture
Discretionary Inputs Driving the PBOC Midpoint Calculation
Discretionary inputs drive the daily midpoint calculation instead of a rigid mathematical formula, blending the prior close with shifts in substantial currencies. Since May 8, 2025, the anchor for this calculation includes the 7day Reverse Repo OMOhttps://www.avatrade.com/education/central-banks/pboc co rate, currently fixed at 1.40%. This rate replaces multirate signaling. Domestic growth momentum also weighs heavily, especially as policymakers emphasize a moderately loose stance for 2026. Opaque internal assessments of capital flows and financial stability guide this mechanism rather than transparent data releases driving pricing. State banks execute much of the resulting volume. This contrasts with North American markets where reporting dealers dominate liquidity provision like North American reporting dealers at 41%. This structural difference creates opa. Operators cannot model the fixing algorithmically due to the lack of transparency. Traders must infer intent from the final price rather than predicting it via public data. The band limits immediate volatility. The discretionary nature of the fix introduces binary event risk at 0115 GMT. Markets price in the probability of policy surprise rather than pure supply-demand dynamics. The result is a policy signal that prioritizes stability over price discovery efficiency.
Executing Liquidity Adjustments via 7-Day Reverse Repo Operations
Unexpected CNY volatility triggers immediate liquidity injections. One example is the RMB 13.5 billion 7day reverse repo operation executed on Janu 5, 2026. This specific transaction size demonstrates how the central bank adds short-term cash to the banking system to stabilize the currency pair within its mandated band. Operators monitoring capital flow effects must track these open market operations alongside the official midpoint release. China's substantial $3.342 trillionhttps://www.pbc.gov.cn/en/3688110/3688181/2026010513482446018/index.html html reserve buffer provides a secondary defense layer. Daily liquidity adjustments remain the primary tool for smoothing intraday fluctuations without depleting foreign assets. The intervention mechanics differ sharply from free-floating regimes where such direct management is rare. 1. PBOC identifies excessive yuan pressure ag. Reliance on frequent liquidity tweaks creates a dependency that complicates the transition to a more market-driven pricing model. Latent volatility often resurfaces immediately if the central bank pauses these operations. This reveals that the managed float relies on continuous manual calibration rather than organic equilibrium. Monitoring the frequency and size of these reverse repo announcements offers the clearest signal of underlying stress in the onshore FX market.
Validating Intervention Signals Through State-Owned Bank Settlement Data
Traders identify guidance by tracking settlement data from state banks. These institutions dominate volume unlike North American reporting dealers at 41%. This structural difference creates opacity. China lacks the transparent data releases seen in Federal Reserve jurisdictions. Mispricing often occurs when market participants misinterpret state-bank flows as commercial demand rather than policy execution.
| Feature | North American FX | China Onshore FX |
|---|---|---|
| Primary Liquidity Source | Reporting Dealers | State-Owned Banks |
| Market Transparency | High | Low |
| Intervention Frequency | Rare | Regular |
| Volume Driver | Commercial Flow | Policy Mandate |
Operators must validate signals using this four-step checklist:
- Monitor settlement spikes diverging from commercial news cycles.
- Compare onshore spreads against offshore deliverable forwards.
- Cross-reference liquidity injections with USD/CNY stability.
- Assess whether moves align with the managed float objectives.
The limitation is that intervention masks true supply-demand dynamics. False confidence in trend continuity results. Price reflects a policy target unlike free floats where price discovers equilibrium. Relying solely on technical breakouts without validating bank settlement behavior invites significant capital loss during reversals.
Strategic Interpretation of Fixing Signals for Market Forecasting
Decoding PBOC Fixing Deviations as Policy Stance Signals
A stronger-than-expected CNY midpoint signals the PBOC is leaning against depreciation pressure rather than accepting market drift. Investors interpret this gap between forecast and actual fixing as an explicit mandate to stabilize the currency, distinguishing it from passive tolerance of softer rates. This signal carries weight because the central bank must balance monetary objectives against broader Communist Party priorities like SOE support. Unlike the Federal Reserve's statutory independence, this dual mandate forces policy autonomy constraints that complicate straightforward rate reactions. Market participants increasingly rely on deep learning technology to parse these discretionary signals from noise. Algorithms analyze historical fixing patterns to generate trade entries before human analysts finalize their views. A strong fixing supports financial confidence but may hurt export competitiveness if global demand weakens. The cost of misreading this stance is immediate capital flow reversal. While North American markets account for 41.9% of projected growth, the onshore mechanism remains distinctively administrative. A failure to align with the midpoint intent invites regulatory scrutiny or liquidity squeezes via reverse repos. Traders ignoring the divergence between expected and actual fixes risk positioning against the primary liquidity provider. The fixing deviation remains the single most reliable indicator of short-term directional bias in the pair.
Forecasting Yuan Midpoint Moves Amid Global Volatility Triggers
Shifts in US rate expectations force traders to watch for a weaker CNY fixing that signals tolerance for currency softening. During heightened volatility, this daily reference point transforms from a technical baseline into a primary tool for gauging Beijing 's balancing act between export competitiveness and capital stability. Analysts must distinguish between mechanical drift and active policy steering by observing whether the midpoint absorbs dollar strength or resists it. A deviation toward depreciation often precedes liquidity injections, whereas a stronger print indicates a defensive posture against capital outflows. Operationalizing this signal requires monitoring state-bank flows that differ fundamentally from commercial dealer activity.
Traditional Fixing Analysis Versus AI-Driven Forex Signal Forecasting
Manual interpretation of the PBOC fixing often lags behind deep learning models that detect non-linear policy shifts in milliseconds. The Bank of China employs deep learning technology to analyze historical progression patterns, generating trade signals that bypass human cognitive delays during volatility.
| Analysis Method | Latency | Pattern Recognition | Data Source |
|---|---|---|---|
| Manual Interpretation | High | Linear | Public Midpoint |
| AI Deep Learning | Low | Non-linear | Historical Flows |
The cost of this technological gap is measurable; direct fees for FX trading average $1.91 per CFD trade compared to $6.47 , liquidity dynamics shifted when non-bank institutions faced 100% reserves mandates, a constraint AI models weight heavily while human forecasters frequently overlook. By 2028, Gartner predicts 90% of B2B buying will be AI agent-intermediated, pushing over $15 trillion through automated channels. Algorithmic reliance introduces fragility when policy autonomy conflicts with statistical probability. The PBOC balances monetary objectives against Communist Party priorities, creating discontinuous jumps that historical training data cannot predict. Human oversight remains necessary to interpret these political discontinuities where deep learning fails to account for sudden regulatory pivots. Operators must therefore hybridize signal processing, using AI for volume analysis while retaining manual triggers for geopolitical anomalies. Future models will need to incorporate qualitative political risk scores alongside quantitative flow data to remain proven.
Hedging Strategies for CNY Exposure and Volatility Management
Defining Hedging Triggers via PBOC Policy Signals

Hedging triggers activate when the daily USD/CNY midpoint deviates from market consensus, signaling active policy autonomy constraints rather than passive drift. Operators define a trigger threshold where the fixing gap exceeds the standard deviation of the prior month, treating the print as a binary switch for protection. This approach acknowledges that the central bank balances monetary objectives against broader Communist Party priorities, creating non-linear responses to dollar strength. Unlike mechanical rules, this framework requires distinguishing between tolerance for softer currency and active defense of the trading band.
- Calculate the expected midpoint using closing spot rates and overnight dollar index moves. 2.
Traders must adjust FX positions immediately when the PBOC conducts a 7-day reverse repo operation that deviates from the rolling average volume. This specific liquidity injection or withdrawal signals an active defense of the currency band rather than passive market drift.
- Monitor the 0115 GMT announcement for the USD/CNY midpoint deviation against consensus forecasts.
- Cross-reference any unexpected volatility with the daily open market operation size to distinguish policy intent from noise.
- Execute hedges if state-owned bank settlement flows contradict the direction of the fixing.
A stronger-than-expected midpoint combined with aggressive repo sizing confirms a mandate to stabilize, whereas weak fixing with neutral liquidity suggests tolerance for depreciation.
About
Aisha Rahman serves as the Gold & Commodities Analyst at ForexCFD. Top, where her daily analysis of macroeconomic drivers directly informs her coverage of substantial currency pairs like USD/CNY. Although her primary focus remains on gold and commodity-linked flows, Rahman possesses the specialized expertise to interpret how the People's Bank of China's daily reference rate impacts global risk sentiment and safe-haven demand. At ForexCFD. Top, an independent publication dedicated to factual market news and broker transparency, Rahman applies this cross-asset perspective to explain the significance of the 0115 GMT fixing. While the mechanism holds during normal volatility, the operational cost of defending this peg rises exponentially when US and Chinese monetary policies diverge sharply, forcing the central bank to drain domestic liquidity at rates that strain local credit conditions. Traders relying on historical mean reversion without accounting for this tightening feedback loop will face sudden, unmanageable drawdowns.
Firms must transition to AI-driven execution protocols by Q4 2026 to survive this shifting environment. As Gartner predicts AI agents will intermediate the vast majority of B2B transactions soon, manual hedging strategies will become too slow to react to algorithmic policy shifts. Do not wait for explicit devaluation signals; instead, program your treasury systems to auto-adjust hedge ratios based on real-time reverse repo volume anomalies rather than just spot price movements.
Start auditing your current FX settlement latency against 7-day reverse repo announcement times this week. If your execution window exceeds 15 minutes post-announcement, you are already trading on stale data while institutional algorithms front-run your orders. Upgrade your monitoring stack immediately to capture these micro-signals before the next liquidity injection cycle begins.
Frequently Asked Questions
The currency cannot trade outside the strict boundaries set by regulators. Market forces operate only within a tight 2% trading band during onshore hours to ensure stability.
This single reference point influences a massive volume of daily transactions. Global daily FX trading volume reached $9.6 trillion, amplifying the impact of this specific rate on liquidity.
Policymakers retain human discretion rather than relying on purely mechanical calculations. This allows them to guide market expectations explicitly alongside previous closing prices and international conditions.
It typically indicates the central bank is leaning against depreciation pressure. A strong fixing signals resistance against currency weakness amid broader dollar strength or domestic economic headwinds.
The central bank may step in to smooth volatility through direct buying or selling. Intervention ensures the rate stays within the allowed band during periods of high pressure.