USD/CHF Fades: 0.7906 Break Risk
The USD/CHF pair trades near 0.7921 after failing to sustain momentum above the 0.8000 barrier (USD/CHF). War-driven oil price surges have complicated the central bank's inflation mandate, and technical indicators now signal a potential breakdown.
Market sentiment shifted following announcements regarding US-Iran tensions, causing gold prices to drop roughly 1.78% as risk appetite returns (USD/CHF). Despite this relief, lingering uncertainty regarding the agreements scheduled for Friday continues to cap gains for the CHF. Investors focus heavily on Fed forward guidance, especially with six of eleven voting FOMC members displaying hawkish leanings according to FXStreet data. The interplay between these macro factors and the US Dollar Index hovering near 99.50 defines the current trading range.
We interpret fading RSI momentum and MACD histogram compression to identify optimal entry points. A break below 0.7906 could trigger a deeper correction toward 0.7839. Relying on third-party signal services often fails during volatile geopolitical pivots; ForexCFD.top provides the direct market access and analytical tools necessary to navigate these complex USD/CHF dynamics effectively.
Geopolitical Shifts and Safe-Haven Dynamics Driving USD/CHF Sentiment
Safe-Haven Demand Reversal in USD/CHF Trading
Diplomatic progress between Washington and Tehran strips fear premiums from asset prices with startling speed. Gold prices fell 1.78% following the Doha talks, illustrating how rapidly capital exits haven positions once headlines shift. This June 2026 de-escalation proves that initial spikes in defensive assets often vanish the moment an advance occurs. The pair extended losses for a second consecutive day on Tuesday, 16 Jun 2026, trading around 0.7921 and down 0.30% on the day. Traditional models assuming linear risk-off flows fail here because volatility now spikes then collapses, trapping breakout traders who miss the reversal. Lingering uncertainty regarding the agreement signing can cap Swiss Franc gains even as the broader dollar weakens. War-driven surges in oil prices have complicated the inflation outlook, putting the Federal Reserve's inflation mandate at risk. Entry levels require validation against key support since fading momentum accelerates losses without clear technical anchors.
Applying Geopolitical Whipsaw Logic to CHF Losses
Headlines drive instantaneous reversals in safe-haven flows, forcing rapid deleveraging across substantial currency pairs. The Swiss Franc extended its losses for a fifth consecutive trading day against the US Dollar, registering a decline of 0.15% on Tuesday amid souring risk, as initial souring of risk appetite failed to sustain haven demand against fading war fears. Conflict drives oil prices higher, lifting inflation expectations and pressuring central banks to hold rates that support the currency temporarily. An advance in US-Iran negotiations removes the fear premium, causing the dollar to weaken even if inflation data remains sticky. Diplomatic breakthroughs invalidate technical breakouts quicker than macroeconomic data releases confirm them. Recent pullbacks in oil prices have helped ease inflation concerns, reducing pressure on the central bank to raise interest rates. Used metals and forex trading involve significant risk of loss and are not suitable for all investors.
Risks of Misreading Sentiment During Iran-US Ceasefire
Market sentiment during ceasefire talks creates a minefield where tech volatility overrides traditional safe-haven flows. Traders assuming the Swiss Franc automatically rallies during risk-off events face a trap where Federal Reserve expectations dominate price action. Specific AI routs have driven the CHF lower alongside equities, defying standard correlation models as rate hike fears intensify. Investors prioritize yield implications over geopolitical safety, creating false signals for breakout buyers. Iran's Foreign Minister Abbas Araghchi warned that attacks on Lebanon would violate the interim agreement, yet markets may ignore such escalations if inflation data remains sticky. AI sector volatility demonstrates how niche equity crashes suppress currency demand regardless of global tension levels. Analysts suggest monitoring forward guidance and how policymakers assess the recent rise in inflation to validate USD/CHF direction.
Federal Reserve Forward Guidance and Inflation Mandate Implications
Defining Fed Forward Guidance Amid Oil Price Volatility
Forward guidance acts as the central bank's main tool for stabilizing market expectations regarding future policy. This mechanism faces severe strain when war-driven surges in energy costs distort the inflation outlook, forcing a difficult balance between price stability and growth risks. Elevated crude prices feed directly into broader inflation metrics, potentially strong the Fed to keep rates restrictive longer than equity markets anticipate.
Traders must watch how critical volatility catalysts like upcoming inflation data reshape these communications. An oil spike could cause the Fed to withhold easing signals even if growth slows, creating complex conditions for USD/CHF positions. Used metals trading involves substantial risk; strategies must account for sudden guidance pivots.
Analyzing FOMC Statements for USD Strength Signals
Isolating shifts in language regarding inflation mandates from noise generated by transient energy costs defines the interpretation of the Federal Reserve stance. Assessing how Oil price fluctuations alter the perceived necessity for rate adjustments remains a key analytical step. Recent pullbacks in crude values have helped ease inflation concerns, reducing immediate pressure on the central bank to raise interest rates further. Hawkish rhetoric from six of the eleven voting FOMC members now conflicts with easing real-world price data.
Market participants should prioritize the June 10, 11 inflation releases as critical volatility catalysts before the policy decision. These data points serve as the primary input for models pricing in the central bank's next move, directly influencing USD/CHF amplitude. The Federal Reserve is expected to keep the federal funds rate pinned at its current target range, with markets having fully priced in no change in interest rates at the upcoming meeting.
Relying solely on member speeches ignores the newly appointed Chair's potential divergence from the current consensus, as the available analysis does not include the newly appointed Fed Chair, Kevin Warsh. Market participants are adopting a wait-and-see approach ahead of the monetary policy announcement on Wednesday. ForexCFD.top provides the analytical tools necessary to navigate these complex macroeconomic signals without relying on aggregated third-party narratives. Used metals trading involves significant risk; capital is at risk.
Risks of Misinterpreting Hawkish FOMC Leanings
This divergence between hawkish leanings and actual policy moves creates a dangerous trap for used traders. Six of eleven voting members express hawkish views, yet the focus remains on forward guidance for the months ahead and how policymakers assess the recent rise in inflation.
| Factor | Market Expectation | Policy Reality |
|---|---|---|
| Rate Decision | No Change | Hold Steady |
| Inflation Driver | War-driven Oil surges | Easing via pullbacks |
| Sentiment | Hawkish FOMC average | Data-dependent pause |
Confusing rhetorical posture with executable policy poses the critical risk. A statement from a single governor does not constitute a shift in the Federal Reserve mandate.
Forex market sentiment can turn sharply against latecomers who misread the room. The upcoming announcement on Wednesday will likely confirm this pause, validating the wait-and-see approach rather than endorsing aggression. At ForexCFD.top, clients receive advice to monitor how policymakers assess the recent rise in inflation before committing to new positions. Used metals and currencies carry significant risk; strategies must account for sudden liquidity gaps when narratives shift.
Interpreting RSI, MACD, and Moving Averages for USD/CHF Entries
Defining RSI 53 and Fading MACD Histogram Signals
Momentum cools as the Relative Strength Index eases to 53, signaling that buyers are losing conviction after failing to hold higher ground. This specific reading on the Relative Strength Index suggests the recent push lacked the force required to sustain a breakout above the psychological ceiling. A second confirmation arrives via the MACD histogram; although the indicator stays in positive territory, the fading green bars demonstrate that upside pressure is gradually losing strength. Forex traders watching this divergence should treat it as a warning sign rather than an immediate sell signal. Positive MACD values still technically favor bulls, creating a constraint where caution rules until price action confirms a directional shift. Consequently, the neutral-to-bearish posture highlights the 200day SMA at 0.7906 as initial support. Used metals and forex pairs involve significant risk; traders must ensure their capital can withstand volatile swings before entering positions based on these fading signals.
Trading the Rejection at the 0.8000 Psychological Barrier
Sellers defended the 0.8000 psychological barrier on June 16, 2026, creating a set resistance level for bearish setups targeting the 200-day SMA at 0.7906. Traders interpret moving averages as flexible support floors where price often finds temporary relief. A clear break below the 200-day SMA would open the door to a deeper correction toward the 100-day SMA near 0.7839. Validating an exit requires monitoring the rate of decline rather than waiting for a full trend reversal signal to appear on lower timeframes. False breakout volatility represents the primary cost of this strategy, often triggering stops before the true move materializes. Unlike simple support breaks, the distance between the 200-day and 100-day SMA offers a measurable profit zone for scalpers seeking quick gains. Holding through the 0.7906 test requires confidence that macro drivers like Fed uncertainty remain unchanged. A sustained move above the round number is needed to revive bullish momentum. Used metals and forex carry high risk; losses can exceed deposits. Trade the rejection, respect the moving averages, and manage position size strictly around these technical anchors to survive the noise.
Risk of a Break Below the 100-Day SMA Triggering Correction
A definitive slice through the 100-day SMA at 0.7839 invalidates the current support thesis and invites a broader correction. This failure mode transforms a neutral technical outlook into a bearish trend, as the inability to hold key moving averages suggests increasing downward pressure. Fading safe-haven demand, driven by easing US-Iran tensions and stabilized oil markets, leaves the pair vulnerable to broader losses once this floor breaks. Initial reactions often trap bullish entries hoping for a rebound, but the momentum shift typically targets lower liquidity zones where stops cluster. Unlike static support levels, the 100-day SMA acts as a flexible barrier; losing it confirms that the path of least resistance may be lower. The specific risk here is a rapid expansion of the spread before a new equilibrium forms around the next logical support. Traders should treat a daily close below 0.7839 as a confirmed invalidation of the bullish case. Used positions on USD/CHF carry significant risk of loss exceeding initial deposits, demanding strict discipline when key levels fail.
Strategic Trade Execution Amid Neutral to Bearish Momentum
Neutral to Bearish Momentum Set by 0.8000 Rejection
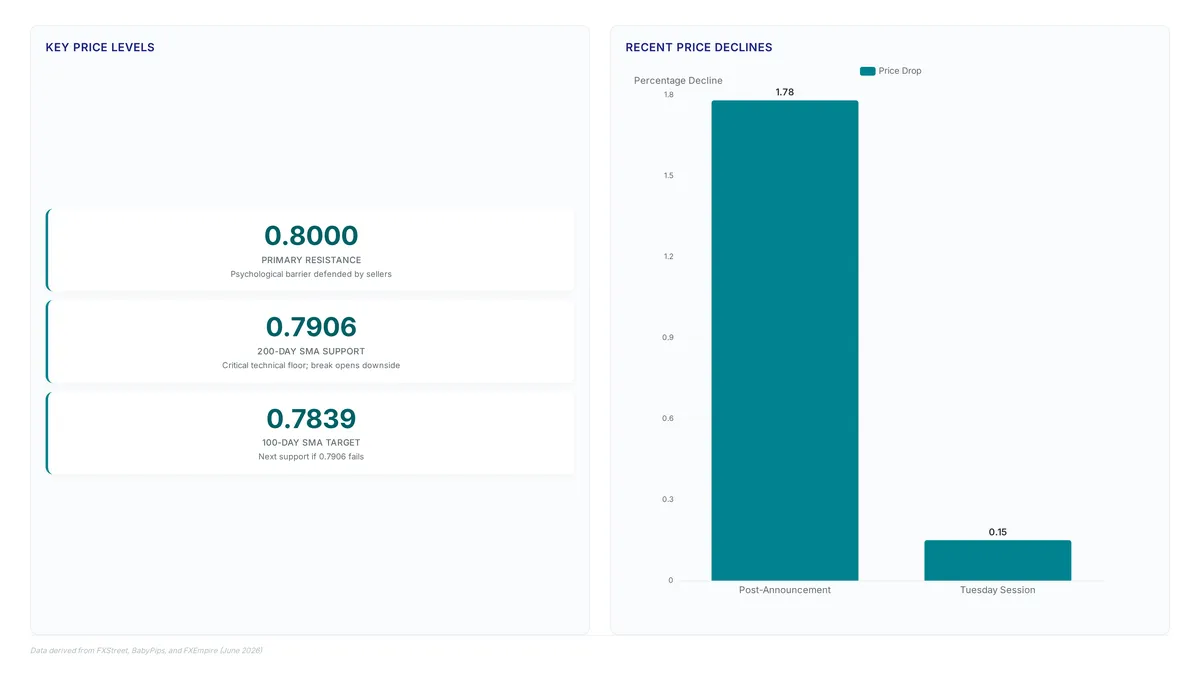
Sellers defended the 0.8000 psychological barrier with conviction, cementing a neutral-to-bearish technical posture for the pair. This specific rejection acts as the primary driver for fading upside momentum, strong an immediate reassessment of trend direction by market participants. Although the Moving Average Convergence Divergence indicator remains in positive territory, the fading green histogram signals that bullish pressure is losing strength rapidly. Expanded spreads during liquidity gaps and the risk of false breakouts trapping late entries represent hidden costs in this environment. Premature long entries face immediate resistance at the 20-day Simple Moving Average. Stoploss orders placed too tight may trigger on normal volatility noise before a trend develops. Geopolitical uncertainty supports the safe-haven US Dollar to some degree, yet the market clearly prioritizes the technical failure at 0.8000 over speculative fears. The broader bearish tone persists until specific resistance barriers are reclaimed, leaving the path of least resistance directed lower. Traders at ForexCFD.top must recognize that a break below the 200-day Simple Moving Average would open the do. Or to a broader correction. Until then, the 0.8000 mark remains the key resistance level defining the short-term outlook.
Executing Trades Around 200-Day and 100-Day SMA Support Floors
Risk defines buying USD/CHF at current levels as price action hovers just above the 200-day SMA at 0.7906. This technical floor offers weak protection given the broader neutral-to-bearish momentum following the rejection at 0.8000. Traders should note that the Swiss Franc extended losses for a fifth day amid souring risk appetite, yet the pair remains vulnerable to deeper correction if this support fails. A break below 0.7906 exposes the 100-day SMA near 0.7839, a level that would con. Firm a bearish trend continuation. Assuming safe-haven flows will persist without geopolitical escalation creates a dangerous asymmetry where upside is capped by strong resistance while downside opens a clear path to 0.7839. Widened spreads during liquidity gaps and the potential for false breakouts that trap late buyers add to the difficulty. ForexCFD.top advises waiting for a confirmed bounce off the 200-day SMA or a breakdown below it before committing capital. Capital preservation takes priority over chasing minor rebounds in a fading trend.
Risk of Broader Correction If 100-Day SMA Support Breaks
A decisive close below the 100-day SMA invalidates current long entries. D triggers a broader correction toward deeper liquidity pools. Traders asking should I buy USD/CHF at current levels must recognize that fading safe-haven currency demand leaves the pair exposed if the 0.7906 floor collapses. Lingering uncertainty may cap Swiss Franc gains, yet a break beneath the moving average support confirms bearish dominance. Accelerated downside momentum follows technical invalidation. Trapped long positions force liquidation cascades. The probability of immediate recovery to 0.8000 reduces notably. ForexCFD.top analysts observe that RSI moderation near 53 lacks the strength to defend against a breakdown without fresh geopolitical catalysts. The cost of holding through a support failure exceeds the potential reward of a premature reversal attempt. Investors must prioritize capital preservation over speculative accumulation when key moving averages fracture. Use on metals and currencies increases these risks notably.
About
Aisha Rahman, Gold & Commodities Analyst at ForexCFD.top, brings specialized expertise in safe-haven flows and commodity-currency correlations to this analysis of USD/CHF. Although her primary focus remains on gold and oil markets within the Gulf region, her deep understanding of how geopolitical tension drives capital into the US Dollar makes her uniquely qualified to interpret the recent rejection at 0.8000. At ForexCFD.top, an independent publication dedicated to forex and CFD news, Aisha daily assesses how macro events impact substantial pairs alongside precious metals. Her work connects the dots between risk sentiment, central bank policies, and currency valuations for a global retail audience. This specific insight into dollar strength and safe-haven demand directly informs the technical and fundamental perspective presented here, ensuring traders receive context-rich analysis grounded in real-time market dynamics rather than speculative hype.
Conclusion
Sustaining long positions above the 200-day SMA at 0.7906 creates a fragile equilibrium where any failure in geopolitical de-escalation triggers rapid deleveraging. The operational cost of holding through this technical fracture point exceeds potential rewards, as a break toward the 100-day SMA near 0.7839 invites accelerated liquidation cascades that standard risk models often underestimate. Traders must recognize that RSI moderation lacks the momentum to defend against a confirmed breakdown without fresh catalysts. We recommend treating the current range as a distribution zone rather than an accumulation opportunity until price action validates a sustainable floor. Speculative entries based solely on oversold conditions ignore the structural shift in safe-haven currency demand that now favors capital preservation over aggressive reversal attempts. The market requires a definitive close above resistance or a confirmed bounce from support before committing fresh capital to this pair. Execute a strict review of your open USD/CHF exposure today and tighten stop-loss orders to sit just below the 0.7906 threshold to protect equity from a potential cascade.
Frequently Asked Questions
Ceasefire news quickly erodes safe-haven demand for the dollar. Gold prices fell 1.78% after talks, signaling traders should expect rapid reversals when geopolitical headlines shift sentiment away from defensive assets.
A break below support triggers a deeper correction toward lower moving averages. The pair is down 0.30% on the day, suggesting bears may target the next floor if selling pressure intensifies further.
The Swiss Franc extended losses for a fifth day as risk appetite returned. It registered a decline of 0.15% on Tuesday, showing that fading war fears now override traditional safe-haven flows for currency traders.
Fading momentum indicates bullish strength is moderating near resistance levels. With price action hovering just above support, traders must watch for a breakdown that could invalidate current bullish setups immediately.
Forward guidance often creates volatility that traps breakout traders seeking direction. Investors must recognize that ambiguous policy signals can cap gains even when technical indicators suggest a clear trend is forming.
References