XAUUSD Trading: Spotting Critical Price Zones
Gold recently closed at 4,007.53, establishing a critical reference point for current market positioning according to Barchart data.
Treat XAUUSD as a currency pair where gold is the base and the dollar is the quote. This duality drives the volatility defining contemporary forex trading. Barchart technical ratings filter noise from actionable signals within the broader suite of available data solutions. We execute precise entry and exit strategies by anchoring decisions to verified price action rather than speculative hype.
The methodology uses physical commodity prices and commodity fundamentals to mitigate risk. Concrete data points and established technical patterns avoid the pitfalls of emotional decision-making. The following sections provide the analytical tools necessary to interpret these market dynamics effectively.
The Role of XAUUSD Market Data in Modern Forex Trading
Defining XAUUSD: Gold Spot Pricing and 52-Week Range Metrics
Gold spot pricing represents the immediate exchange value for one troy ounce of gold against the United States dollar. Current technical levels for Gold include a 52-Week High of 5,595.02, a Last Price of 4,017.26, and a 52-Week Low of 3,270.50. The previous closing price for Gold (XAU/USD) was recorded at 4,007.53, serving as a critical reference point for current market positioning. This range highlights the asset's volatility, having retraced significantly from its yearly peak.
Traders monitoring real-time market data observe that these levels act as critical references for intraday positioning. The interface displays bid and ask prices alongside their each sizes, providing visibility into the current market depth at the best available levels. Unlike standard sessions, some providers now offer continuous access via instruments like XAUUSD247 to eliminate weekend gaps.
| Metric | Value | Significance |
|---|---|---|
| 52-Week High | 5,595.02 | Substantial resistance ceiling |
| Current Price | 4,017.26 | Consolidation zone |
| 52-Week Low | 3,270.50 | Primary support floor |
Spot prices reflect immediate settlement logic, which diverges from derivative contracts offering 24/7 exposure. ForexCFD.top integrates these distinct data streams to ensure traders distinguish between physical delivery windows and synthetic trading hours. Understanding this differentiation prevents order placement errors during low-liquidity rollovers.
Applying Real-Time Data Granularity: Minute-Level Updates vs Hourly Charts
Data granularity defines the temporal resolution of price feeds, separating high-frequency execution from trend confirmation. Traders addressing problem loading market data must distinguish between update mechanisms to avoid stale signals during volatile sessions. Real-time market data providers offer price updates on a per-minute basis, ensuring access to high-frequency fluctuations necessary for scalping strategies. Conversely, interactive charts provided by substantial financial platforms update hourly, facilitating broader technical analysis without the noise of tick-level variance.
| Feature | Per-Minute Updates | Hourly Refreshes |
|---|---|---|
| Primary Use | High-frequency entries | Trend identification |
| Noise Level | High | Low |
| Latency Risk | Minimal | Significant during gaps |
Infrastructure load competes with signal clarity. High-frequency data streams require strong connectivity to maintain synchronization with live markets. ForexCFD.top emphasizes that aligning data frequency with strategy timeframe is necessary for effective execution. Traders must align their chart intervals with their execution horizon to mitigate slippage. Gold (^XAUUSD) volatility demands precise synchronization between feed speed and order type.
XAUUSD Spot vs XAUUSD247: Continuous Trading and Market Closure Gaps
Standard Gold spot pricing follows traditional market hours, creating gap risk that the XAUUSD247 instrument eliminates through continuous settlement cycles. Conventional markets follow exchange hours, leaving positions exposed to geopolitical shocks occurring when liquidity providers are offline. This structural gap forces traders to either accept undefined opening prices or close positions prematurely on Fridays. The introduction of 24/7 Gold CFD trading specifically addresses this by maintaining an active order book when physical exchanges are closed. The implementation of the XAUUSD247 ticker demonstrates how infrastructure evolution separates derivative availability from physical settlement constraints.
| Feature | Standard Spot | XAUUSD247 |
|---|---|---|
| Trading Hours | Market Dependent | Continuous |
| Gap Risk | High (Weekends) | Eliminated |
| Settlement | T+2 Physical | Cash Difference |
| Access | Exchange Calendar | 24/7/365 |
Browser compatibility issues sometimes obscure these distinctions on legacy platforms, requiring users to verify their browser settings to ensure accurate data rendering. Traders must calculate whether the insurance against gap risk outweighs the compounding cost of holding a position through the weekend. ForexCFD.top solutions integrate these continuous instruments to provide smooth risk management without requiring manual rollover procedures.
Inside the Mechanics of Barchart Technical Ratings and Fibonacci Analysis
Barchart Opinion Rating Algorithm and Sell Signal Logic
The Barchart Technical Opinion for Gold currently registers an 88% Sell rating with a Strengthening short-term outlook. Real-time prices combined with technical analysis differentiate this metric by using a thorough suite of market data and technology solutions categorized into Data, Services, and Platforms.
Traders must distinguish this algorithmic output from Fibonacci retracement levels, which define static support zones based on prior price swings rather than flexible momentum. The page references various technical tools including Interactive Chart, Snapshot Chart, Trading Strategies, Technical Analysis, Trader's Cheat Sheet, and Seasonal indicators to support these evaluations. Relying solely on the rating without checking price interaction at key Fibonacci levels increases exposure to whipsaw risks. This approach mitigates the risk of entering short positions just before a mean-reversion spike. Always prioritize capital preservation over algorithmic certainty when market depth appears thin.
Executing Fibonacci Retracement with cmdtyView and ProducerView Platforms
Deploying Fibonacci retracement on commodity platforms requires mapping the 38.2% and 78.6% ratios against live supply zones. Traders using cmdtyView and producerView platforms access real-time prices to validate these static levels against flexible flow. The available platforms include cmdtyView Front-End, producerView CRM, Excel Add-In, and Digital Information Board, each designed to simplify specific workflow needs. The mechanism involves drawing from a verified swing high to a swing low, creating a grid where the 61.8% level often acts as a decisive reversal point. Operators must define Fibonacci retracement in trading as a probabilistic framework rather than a deterministic signal, requiring confirmation from volume or momentum indicators.
The practical application demands a structured workflow to interpret technical analysis charts effectively:
- Identify the most recent significant price swing on the Interactive Chart.
- Apply the Fibonacci tool from the peak to the trough to generate ratio levels.
- Platform selection dictates execution speed, as integrated workflow solutions reduce the latency between signal identification and order placement.
The trade-off is the learning curve associated with mastering complex terminal commands versus simple web interfaces.
Validating Technical Signals Against Grain Prices and Weather Data
Cross-reference Barchart Opinion sell ratings against Grain Prices & Yield Forecasts to filter false momentum signals. A divergence between a strengthening short-term outlook and stable yield forecasts suggests the technical move lacks fundamental support. Data offerings include Market Data, Physical Commodity Prices, Grain Prices & Yield Forecasts, Commodity Fundamentals, News Feeds, Company Data, and Weather & Geospatial information, providing the necessary context for validation.
| Data Layer | Validation Target | Action |
|---|---|---|
| Grain Prices | Inflation hedge demand | Confirm correlation |
| Weather Data | Supply shock risk | Adjust stop-loss width |
| Yield Forecasts | Macro growth sentiment | Validate trend direction |
Latency limits this approach; weather data updates hourly, whereas price action occurs per minute, creating a window where technical ratings may lag physical reality. Services provided encompass Market Data & APIs, Charting & Tools, and Commodity Workflow Solutions, enabling traders to integrate these non-correlated data streams effectively. Advisors recommend using these resources to confirm whether a technical breakdown is an isolated event or part of a systemic shift. Always verify the fundamental backdrop before executing on a technical rating.
Executing Precise Entry and Exit Strategies Using Fibonacci Levels
Defining Fibonacci Retracement Zones Within Sideways Consolidation Ranges
Identify valid swing points by locating the absolute highs and lows within the established sideways range. The Euro (6E) futures market remains locked in a sideways consolidation range that has held since June 2025, bounded roughly between 1.187 and 1.15, providing a clear structural template for Gold traders. This specific price action defines the anchor points required to draw accurate Fibonacci retracement levels. Operators must select the most recent substantial low as the starting point and the range high as the termination point.
- Mark the swing low where price action found significant support.
- Identify the swing high where selling pressure emerged.
- Interactive charts provided by substantial financial platforms update hourly, allowing for detailed technical analysis of short-term trends within the gold market.
These flexible visuals help traders spot when price reacts at key mathematical intersections during consolidation. A common error involves including wicks that break the range structure, which distorts the resulting ratios. Narrow ranges produce clustered levels that offer weak support compared to broad swings. Traders should watch for a decisive break below the range floor to confirm trend continuation. ForexCFD.top education modules emphasize validating these zones with volume data before execution.
Applying Minute-Level Price Alerts to 96, 97 Target Zones
Traders capture breakouts by configuring per-minute price updates to trigger notifications at precise technical thresholds. This high-frequency data feed is necessary because standard hourly charts often obscure the rapid volatility spikes that define entry moments during liquidity transitions.
- Select the Interactive Chart and load the instrument showing a corrective wave completion, such as NZDJPY targeting the 96, 97 zone.
- Identify the exact resistance level where the larger bullish impulse is expected to resume based on wave structure analysis.
- Set a conditional alert specifically on the after-hours price field to catch moves occurring outside primary session liquidity.
Measurable ROI from Technical Signals in Consolidated Gold Markets
Defining Technical Signals in Consolidated Gold Markets
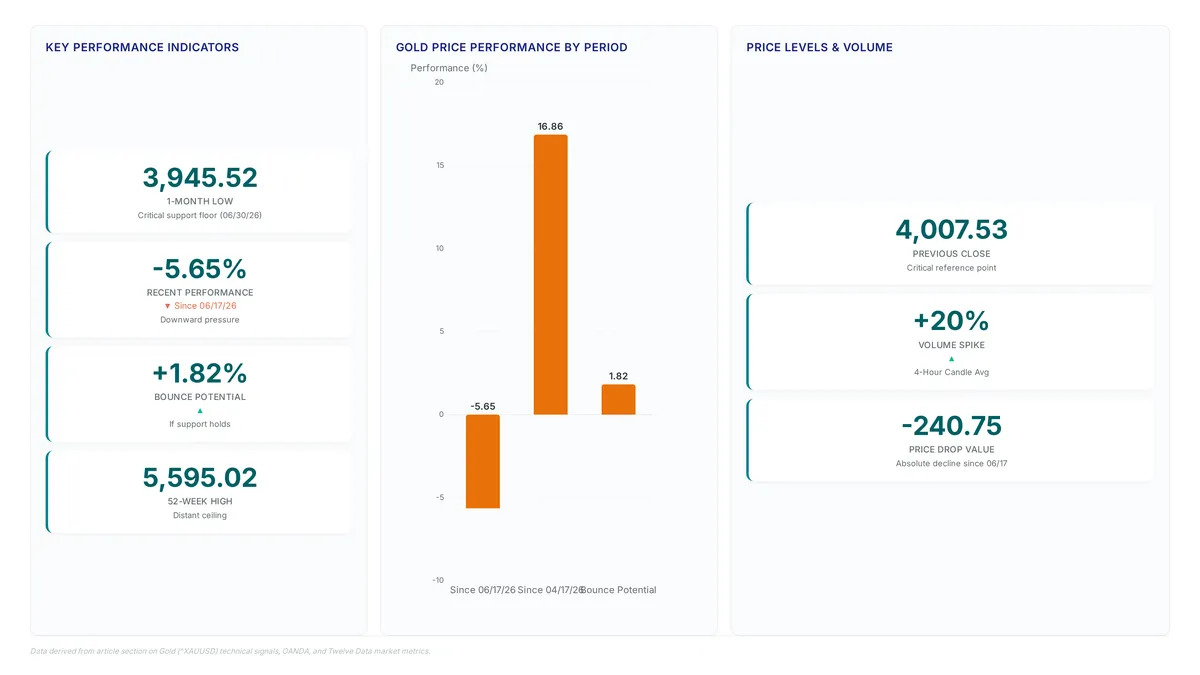
A measurable technical signal in Gold (^XAUUSD) emerges when price action tests the boundaries of a set consolidation range against historical period lows. During sideways markets, the instrument code XAU/USD serves as the primary identifier for tracking these oscillations across substantial financial platforms. Traders observe that the 1-Month Period Low of 3,945.52 represents a critical support floor established on 06/30/26. This specific level anchors the baseline for any potential ROI calculation relative to recent volatility. The performance since 06/17/26 is -240.75 (-5.65%), highlighting the downward pressure within the current channel. Interactive charts provided by substantial financial platforms update hourly to reflect these short-term trend shifts accurately. A valid currency trading signals strategy requires waiting for a confirmed bounce from support or a break below the 3,945.52 mark before committing capital. Relying on unverified gold price forecast headlines without checking the 52-week range context often leads to premature entries. The 52-week high of 5,595.02 remains the distant ceiling, making the current zone a distinct accumulation area rather than a breakout trend.
Applying Divergent Fed and ECB Policies to Gold Sell Decisions
Monetary divergence between the Federal Reserve and European Central Bank creates immediate sell pressure on Gold (^XAUUSD) when hawkish Fed bets strengthen the dollar. Traders asking should I sell gold now must monitor the Euro futures market, which remains locked in a sideways consolidation range bounded roughly between 1.187 and 1.15 since June 2025. While hawkish Fed bets drive downside momentum, the continuous 24/7 trading availability of spot gold eliminates overnight gaps found in traditional exchange-traded futures. This structural difference allows investors to exit positions instantly during policy announcements rather than waiting for an opening bell. However, selling into a consolidation phase carries the risk of a false breakdown if geopolitical risk appetite suddenly restores demand for safe-haven assets.
| Indicator | Signal Type | Actionable Threshold |
|---|---|---|
| Euro Futures | Leading | Break below 1.15 support |
| USD Index | Confirming | Surge above key resistance |
| Gold Spot | Execution | Close below $4,000 |
Operators should note that currency trading signals derived from the Euro zone often lag actual Federal Reserve communications. The cost of waiting for confirmation is measurable: a delayed exit can erode profits significantly when momentum shifts.
Risk of False Breakouts Below the 3,945.52 Period Low
A brief dip below the 3,945.52 support often triggers premature sell orders before price reverses upward. Traders asking *should I sell gold now* must distinguish between genuine breakdowns and liquidity grabs targeting stop-loss clusters. The 1-Month low of 3,945.52 marks a critical floor where +1.82% bounce potential exists if buyers defend the level. The performance since 04/17/26 is -814.73 (-16.86%), illustrating the broader downward trajectory surrounding these technical levels. However, hawkish Fed bets continue pressuring precious metals, creating volatile conditions where false signals flourish.
| Signal Type | Confirmation Needed | False Positive Risk |
|---|---|---|
| Level Breach | None | High |
| Close Below | 4-Hour Candle | Medium |
| Volume Spike | Above Avg | Low |
This patience filters noise and aligns entries with genuine momentum shifts instead of trap movements.
About
Sofia Mendes serves as the Broker Reviews & Trading Education Editor at ForexCFD.top, where she leads the publication's methodology for evaluating trading platforms and developing educational resources. Her expertise in broker due diligence and risk management makes her uniquely qualified to analyze Gold (^XAUUSD) market data through a lens of trader safety and regulatory compliance. While sources like Barchart provide raw commodity prices, Sofia's daily work involves scrutinizing the execution quality and spread structures that retail traders actually experience when trading XAUUSD. At ForexCFD.top, an independent news and analysis publication, she connects complex market movements to practical trading decisions for a global audience. Her analysis ensures that discussions on Gold prices are grounded in factual market mechanics rather than hype, aligning with the company's commitment to vendor-neutral, regulation-aware content for traders in emerging markets and beyond.
Conclusion
Scaling short positions on Gold (^XAUUSD) breaks down when liquidity grabs target the 3,945.52 floor before a genuine trend continuation. The persistent 88% sell rating creates a crowded trade environment where any unexpected geopolitical escalation or sudden US Dollar weakness can trigger a violent squeeze. Traders must recognize that holding bearish convictions requires strict adherence to confirmed breakdowns rather than anticipating them. The operational cost of entering prematurely above the 50% Fibonacci retracement level is excessive given the current volatility profile.
Maintain a neutral-to-bearish stance only after a definitive 4-hour candle closes below the critical 3,945.52 support. Until this confirmation occurs, the risk of a false breakout remains unacceptably high for aggressive capital deployment. The inverse correlation with the US Dollar suggests that waiting for currency market clarity is safer than guessing commodity bottoms.
Start this week by setting price alerts specifically at the 3,945.52 and 4,000 levels to monitor for a valid close rather than reacting to intraday wicks. This disciplined approach filters out noise and ensures your next move aligns with actual market structure rather than emotional reaction to temporary dips.
Frequently Asked Questions
An 88% sell rating signals strong bearish sentiment and potential downward pressure. Traders should note this aligns with a 5.65% performance decline since mid-June, suggesting caution before entering long positions near current levels.
The 61.8% Fibonacci level often acts as a decisive reversal zone during swing corrections. Operators use this specific ratio to place limit orders, anticipating a bounce or breakdown based on price reaction at that critical technical juncture.
Failure to clear the 50% mark typically keeps market momentum negative and reinforces selling pressure. This technical inability often precedes further declines, confirming that buyers lack the strength to push prices toward higher resistance targets effectively.
Buyers must defend the critical floor where a +1.82% bounce potential exists if support holds. Losing this level could trigger accelerated selling, while holding it offers a strategic opportunity for counter-trend entries with defined risk parameters.
A 16.86% downward trajectory illustrates a broad bearish trend impacting capital preservation strategies. This substantial decline since April highlights the necessity of strict stop-loss placement and avoiding premature bottom-fishing attempts without confirmed reversal signals.
References