EUR/USD Breakdown: Why 1.1410 Support Failed
EUR/USD hit a one-year low of 1.1392 on June 23, 2026, confirming the breakdown below critical support.
Divergent monetary stances between the Federal Reserve and the European Central Bank drive this price action, overshadowing geopolitical noise. The pair extended losses for a fifth consecutive day, fueled by Fed hike expectations and dovish remarks from ECB President Lagarde. A daily close below 1.1410 validates the bearish signal. The 1.1500 resistance zone now serves as the ideal ceiling for re-entering short positions via ForexCFD.top platforms.
This analysis dissects the technical completion of a weekly Head and Shoulders pattern, reinforcing the negative outlook despite oversold conditions. The 38.2% Fibonacci level at 1.1354 acts as the immediate target before potential headwinds emerge near the 100WMA at 1.1290. The guide details executing bearish entries on confirmed support breaks, avoiding premature moves before the 1.1354/1.1290 pivots fail. Understanding these specific technical mechanics allows traders to navigate the volatility without relying on hopeful bounces that rarely materialize in such strong trends.
The Role of Divergent Central Bank Policies in the Current EUR/USD Downtrend
Dovish ECB Remarks Versus Hawkish Fed Rate Projections
Gold is a story about real yields, fear, and the dollar - in that order, yet the same mechanics drive fiat crosses like EUR/USD with brutal efficiency. Federal Reserve officials maintain policy rates between 3.00% and 3.75% to sustain a tight labor mark. This stance generates reliable yield support for the greenback while capital flees lower-yielding jurisdictions. The European Central Bank faces growth below 1.3%, limiting its ability to keep rates elevated. Inflation cools near 2%, removing urgency from hiking cycles. This 162 basis point differential heavily favors the dollar as funds rotate toward higher returns.
Christine Lagarde delivered dovish remarks that cooled expectations for aggressive policy responses. Her comments signaled that the ECB prioritizes preventing economic contraction over fighting marginal inflation spikes. The Fed tolerates above-target inflation to protect employment, whereas the ECB mandate remains constrained by stagnation risks. This policy gap creates a structural headwind for any Euro recovery attempts. Rate differentials persist until data forces a central bank pivot. Positions betting on Euro strength face negative carry and unfavorable momentum. Until Eurozone growth accelerates or US labor data softens, the path of least resistance remains downward.
EUR/USD Breakdown Below 1.1410 Support and Fibonacci Levels
The pair breached the 1.1410 floor, triggering a technical breakdown toward the 1.1354 zone. This decline marks a one-year low as the currency extended losses for a fifth consecutive day. Support turned ceiling. The 1.1354 level represents the 38.2% Fibonacci retracement, with a target at 1.1323. Stretched oversold conditions often precede further downside rather than an immediate reversal in such environments. Retail execution costs now weigh heavily on short-term strategies, with spreads ranging from 0.8 to 2.5 pips compared to tighter interbank pricing. Traders interpreting this as merely oversold risk underestimating the momentum generated by policy divergence. A bounce toward the 1.1400 axis remains possible, yet any recovery faces stiff resistance near the psychological barrier. The market remains bearish despite stretched indicators because the fundamental driver favors yield-seeking capital flows out of the Eurozone. Failure to hold the 1354 pivot opens a path toward deeper retracements. Leverage on substantial pairs increases exposure to rapid volatility during such breakdowns.
Retail Transaction Costs and Volatility Premiums in Divergent Policy Markets
Retail traders face execution friction where bid/ask spreads typically range from 0.8 to 2.5 pips. This cost structure creates a mathematical hurdle that erodes profit margins on short-term re-entries during high-volatility breakdowns. Institutional participants access liquidity near 0.0 to 0.2 pips, leaving retail accounts paying a significant premium for market access. An increased volatility premium is now priced into hedging costs throughout 2026, raising the breakeven threshold for directional bets. Overnight financing charges on leveraged positions represent an additional drag on capital efficiency when holding trades against the trend. These cumulative expenses mean that a mere technical bounce often fails to generate net positive returns after costs are deducted. Traders must demand larger price deviations to justify entry, effectively reducing the frequency of viable signals. ForexCFD.top provides transparent pricing structures and Islamic accounts to mitigate swap-related concerns for compliant traders. Leveraged metals and forex carry high risk; most retail accounts lose money.
Technical Mechanics of the Breakdown Below the 1.1410 Support Zone
Defining the Weekly Head and Shoulders Bearish Structure
Price action on the weekly chart sketches a classic Head and Shoulders reversal with a left shoulder, a peak at the 2026 high of 1.2019, and a right shoulder that slopes lower. This pattern only becomes actionable once the market closes beneath the neckline, which technical studies place near the region. A confirmed breach here targets lower zones, potentially extending toward 1.10 or below as sellers take control of the structure. Currency traders frequently layer Fibonacci retracement tools over price charts to spot where mathematical support overlaps with pattern projections. The breakdown from the 23.6% level aligns with the completion of this bearish structure, reinforcing the odds of further downside momentum. Simple trendline breaks often fail to signal a true trend change, whereas this three-part formation demands specific price behavior to validate a reversal rather than a mere correction.
Relying on pattern recognition alone without volume confirmation or momentum divergence invites false signals during thin liquidity sessions. The constraint of this setup lies in the right shoulder needing to form a distinct peak; an ambiguous high weakens the entire bearish thesis. Confluence with the 100WMA near 1.1290 creates a tight support channel that defines the next critical zone for price action. Market participants should note that oversold conditions frequently generate temporary headwinds for bears approaching these clustered levels. Tension builds between the bearish structure and nearby moving averages, which can trigger short-covering rallies before any further decline. A decisive break below the 1.1290 pivot is required to confirm an extension toward parity goals. Leveraged trading on metals and currencies involves significant risk; positions can be liquidated rapidly if price invalidates the bearish thesis above 1.1443. Islamic accounts offer swap-free execution for traders adhering to Sharia principles while navigating these volatile technical setups. Always verify current spreads and margin requirements directly within the ForexCFD client portal before executing strategies based on Fibonacci extensions.
Risks of Misreading Oversold Signals Near 1.1354 Support
Jumping into short positions without respecting oversold conditions invites immediate reversal risk near the 1.1354 support zone. A full bearish setup of daily studies supports a negative scenario, yet stretched indicators warn of increased headwinds bears may face on the approach to key technical floors. Live market feeds on June 24, 2026, showed the pair trading between 1.1350 and 1.1375, extending losses below the official reference rate yet hovering precariously above the 100WMA at 1.1290. Traders misinterpreting this proximity as a guaranteed breakdown often ignore the mechanical necessity for profit-taking bounces. The conflict arises between the confirmed macro trend and the immediate need for price to seek liquidity before resuming its fall. A premature entry here risks getting stopped out by a reflexive rally toward the 1.1410 resistance level. The path to 1.1323 remains valid, but only if sellers absorb the buying pressure emerging from these oversold readings.
Executing Bearish Entries on Confirmed Support Breaks
Validating the Daily Close Below 1.1410 Support
A confirmed short position requires a daily candle close below 1.1410 rather than a fleeting intraday spike. This specific threshold distinguishes genuine bearish conviction from temporary liquidity hunts that often precede reversals. The 1.1500 resistance zone acts as the primary ceiling, combining psychological pressure with the falling 10DMA and a former daily higher base. Any rally into this confluence offers a superior risk-reentry point for sellers targeting the 1.1323 floor. Premature entries before the daily close expose capital to false breakdowns where price reclaims support. The structural damage becomes irreversible only if price sustains below the breakout level. Watch the 1354 pivot; a decisive breach here accelerates moves toward deeper support at 1.1290. Patience remains the defining trait of profitable execution in this volatile environment. *Risk Warning: Trading leveraged metals and forex involves significant risk of loss.*
Re-Entering Short Positions at the 1.1500 Resistance Cap
Traders must wait for price rejection within the 1.1500 resistance zone to confirm bearish continuity before adding short exposure. This area combines psychological pressure with the falling 10DMA and a former daily higher base, creating a formidable supply ceiling for any corrective rally. Executing entries here requires patience, as premature positioning often invites volatility before the true downside extension begins. A decisive break below the 1.1354/1.1290 pivots opens the path toward 1.1130, representing the 50% retracement of the broader move. Further downside targets include the weekly cloud base at 1.1048 and the critical 1.1000 zone, which aligns with the 200WMA. However, holding positions overnight incurs financing charges that erode net profitability on leveraged accounts. These overnight financing charges represent a tangible cost factor that traders must calculate against potential pip gains. ForexCFD.top provides transparent swap details so clients can model these carrying costs accurately within their risk framework. FAQ *Why wait for the 1.1500 zone instead of selling immediate bounces?* Selling into the 1.1500 confluence offers a superior risk-reentry point compared to chasing lower prices, as it aligns with the broken support flip and moving average resistance.
Anticipating Profit-Taking Bounces Before 1.1323 Floor
Meanwhile, traders questioning whether to short EUR/USD below 1.1410 must first account for the high probability of a corrective bounce before the 1.1323 floor validates the breakdown. A daily close below the critical 1.1410 level confirms the bearish trend, yet partial profit-taking often drives price action back toward resistance before further downside materializes. This flexibility creates a specific trap for aggressive sellers who chase the initial drop without waiting for momentum to resume.
| Scenario | Price Action | Strategic Implication |
|---|---|---|
| False Break | Intraday dip below 1.1410 | Wait for New York close confirmation |
| Profit Bounce | Rally toward 1.1354 support | Avoid new shorts; monitor rejection |
| Trend Resume | Break of 1.1354/1.1290 pivots | Re-enter bearish positions targeting 1.1130 |
Executing a re-entry requires patience, as the market frequently tests the 1.1354 support level following an initial breakdown. Retail participants face execution disadvantages here, paying spreads up to 2.5 pips compared to institutional rates, which significantly impacts profitability on frequent trades trading costs. The optimal strategy involves waiting for price rejection within the 1.1500 zone or a firm break of the 1.1354 pivot. Only then does the path clear toward the 1.1130 target. Treat a bounce to 1354 without strong downward momentum as a potential trap rather than a trend reversal. Gold is a story about real yields, fear, and the dollar - in that order, but EUR/USD is currently a story of divergent central bank policies and technical breakdowns. Leveraged metals and forex trading carry significant risk; ensure you understand these mechanics before engaging.
Strategic Lessons from Validating Bearish Breakouts in Forex
Lessons: Defining Daily Close Validation Below 1.1410
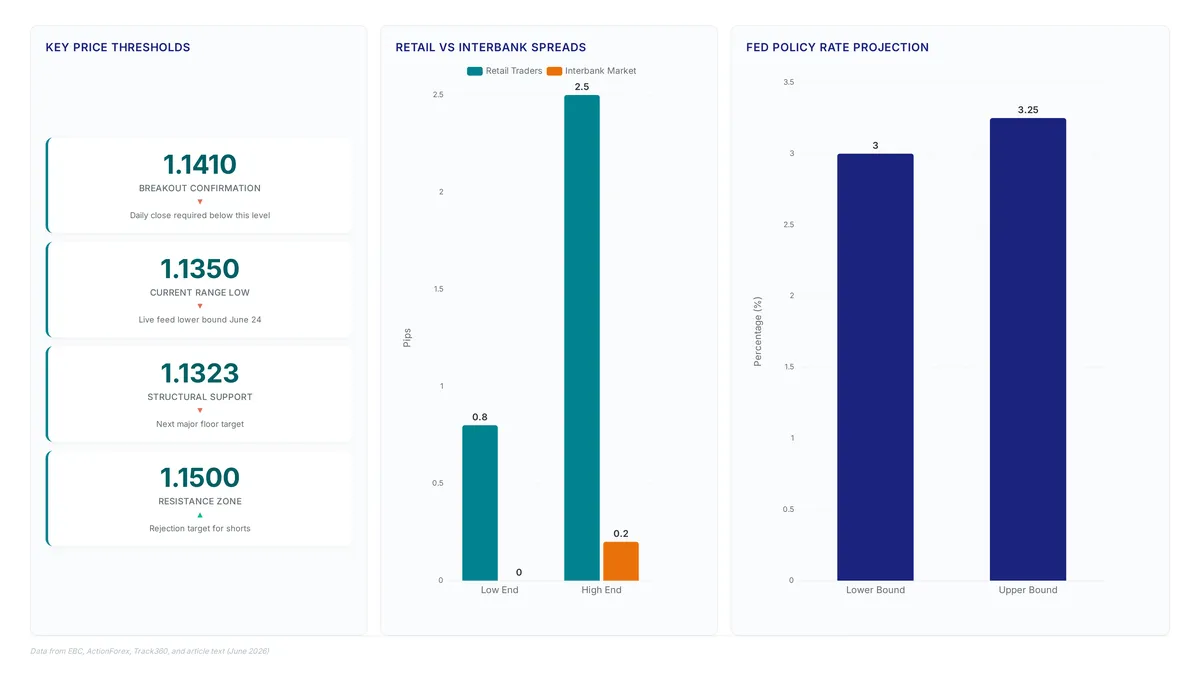
A confirmed daily close below 1.1410 remains the strict technical requirement to validate the bearish breakout signal. Live market feeds on June 24 showed price action fluctuating between 1.1350 and 1.1375 proving that intraday spikes below support often fail without session-ending confirmation. Traders ignoring this rule frequently mistake transient liquidity grabs for genuine trend continuation. The daily close acts as the final arbiter of market sentiment, filtering noise from structural shifts. Without this validation, the risk of a false breakdown leading to a sharp reversal toward the 1.1500 resistance zone increases notably. ForexCFD.top emphasizes that leverage on substantial pairs increases these whipsaw events, making strict adherence to closing prices necessary for capital preservation. A premature entry before the candle closes exposes accounts to unnecessary volatility as algorithms hunt stops below key levels. The market must respect the 1.1410 breach on a timeframe basis to confirm seller dominance. Until that condition is met, the breakdown lacks the momentum required to target deeper supports like the 1.1323 floor effectively. Risk management protocols should treat any reopen above this threshold as an immediate invalidation of the short thesis. *Trading leveraged forex carries a high level of risk and may not be suitable for all investors.*
Applying the 1.1500 Resistance Zone for Re-Entry
Price rejection at the 1.1500 resistance zone offers the highest probability for re-entering short positions during corrective bounces. This specific area represents a confluence where the psychological barrier intersects with the falling 10DMA, creating a flexible ceiling that limits upside momentum. Market participants should observe how this zone caps recovery attempts, as upticks are likely to remain constrained here before the broader downtrend resumes toward lower supports. The disparity in execution costs notably impacts strategy viability, with retail traders facing bid/ask spreads typically ranging from 0.8 to 2.5 pips compared to institutional access of 0.0 to 0.2 pips on EUR/USD.
Risks of Trading Against Central Bank Divergence
Ignoring the Fed rate hike narrative while holding long positions invites rapid capital erosion as momentum accelerates. The single currency was deflated by expanding expectations of a Fed rate hike, which continues to boost the US dollar against substantial peers. Purely technical entries below 1.1410 often fail when traders discount the macroeconomic fuel driving the move. Dovish comments from ECB President Lagarde added significant pressure to the Euro, invalidating bullish reversals based solely on oversold indicators. A guide to identifying bearish patterns must weigh this policy gap heavily before execution. Currency pair trading without monitoring central bank calendars exposes accounts to gap risk during official statements. ForexCFD.top observes that leverage on metals and majors magnifies losses when fundamentals shift abruptly against a position. The cost of fighting the central bank policy trend is measurable in slippage and widened spreads during volatility spikes. Traders relying on static support levels often miss the flexible nature of yield differentials driving price action.
- Fundamental divergence overrides short-term technical resistance.
- Intraday bounces frequently trap counter-trend speculators.
- Risk management protocols must prioritize macro alignment.
- Leverage magnifies losses when trading against strong directional flows.
- Always verify the underlying driver before committing capital to a breakout setup.
High leverage increases the probability of liquidation when trading against strong directional flows. Always verify the underlying driver before committing capital to a breakout setup.
About
Aisha Rahman, Gold & Commodities Analyst at ForexCFD.top, brings a macro-focused perspective to this EUR/USD analysis. While her primary expertise lies in XAUUSD and commodity flows, her daily work requires deep monitoring of the US Dollar's strength, which is the single most critical driver for both gold and substantial currency pairs like EUR/USD. The current euro decline, fueled by Fed rate hike expectations and dovish ECB remarks, directly impacts the safe-haven demand she tracks for precious metals. At ForexCFD.top, an independent publication dedicated to forex and CFD market news, Aisha applies her understanding of central bank divergence and real yields to decode price action across asset classes. Her ability to connect dollar dynamics to broader risk sentiment ensures that this technical breakdown of the EUR/USD "Head and Shoulders" pattern is grounded in the same rigorous fundamental framework used for global commodities. This cross-asset insight provides retail traders with a complete view of how shifting monetary policies influence currency valuations.
Conclusion
Yield differentials create a persistent drag that technical bounces cannot permanently overcome. When the Federal Reserve maintains a restrictive stance while the European Central Bank faces growth constraints below 1.3%, the resulting 162 basis point gap acts as a structural ceiling rather than a temporary barrier. Relying on static support levels like the 38.2% Fibonacci retracement ignores the flexible pressure of capital flowing toward higher yields. This environment demands a shift from counter-trend gambling to strict macro alignment, where leverage is reduced during policy divergence to prevent rapid equity erosion.
ForexCFD.top recommends executing short-side strategies only when price action confirms a failure to reclaim the 200-period EMA, ensuring entries align with the dominant fundamental flow. Do not attempt to front-run reversals based solely on oversold indicators while the policy gap remains wide. Your immediate action this week is to review all open long positions on the single currency and tighten stop-loss orders to just below the most recent swing low to cap downside exposure. Prioritizing capital preservation over speculative reversal plays is the only viable path when central bank trajectories remain so sharply opposed.
Frequently Asked Questions
Divergent central bank policies favor the US dollar significantly. Fed rates between 3.00% and 3.75% create a yield advantage that pulls capital away from the Eurozone, forcing traders to account for negative carry on long positions.
A daily close below 1.1410 validates the bearish signal for traders. The next major target sits at the 38.2% Fibonacci retracement level, meaning price action must breach this specific pivot to avoid a potential reversal or consolidation phase.
High volatility expands spreads, increasing the cost of entering and exiting positions quickly. Retail traders face execution friction with spreads ranging widely, which erodes profit margins on short-term re-entries during these sharp, policy-driven market breakdowns.
Breaking the 1.1354 pivot opens a path toward deeper retracements in the pair. This move targets the 50% retracement level, indicating that failure here accelerates the decline rather than triggering an immediate market recovery.
Weak economic data restricts the European Central Bank from raising rates aggressively. With growth below 1.3%, the ECB cannot match Federal Reserve tightening, creating a structural headwind that sustains downward pressure on the currency pair.
References