Central bank decisions: Why gold dropped 1.78%
Gold settled near $4,016 per ounce after a 1.78% drop as ceasefire talks eased immediate geopolitical fears. This price action confirms that central bank decisions currently override geopolitical noise in driving market direction. Divergent monetary policies across substantial economies are creating distinct risk profiles that technical analysis must now navigate.
The mechanics behind this divergence reveal how the Federal Reserve, European Central Bank, and Bank of Japan respond to localized inflation and growth data. Applying technical tools to spot potential intervention risks is essential when market calm masks underlying volatility.
While Brent crude held steady around USD 73 a barrel, the real story lies in the shifting yield differentials driven by these institutions. ActionForex notes that investors are largely ignoring Middle East tensions to focus on data capable of reshaping monetary policy expectations. Understanding these macro drivers is necessary for identifying when quarter-end positioning gives way to trend-defining moves in the third quarter.
Defining the Macro Drivers Behind Quarter-End Market Calm
Non-Farm Payrolls and ECB Flash CPI Mechanics
Financial markets adopted a subdued stance as quarter-end positioning collided with a packed economic calendar. The Non-Farm Payrolls report measures US job creation excluding farm workers and directly shapes Federal Reserve rate expectations. Aggressive Federal Reserve tightening fears receded after June's PCE inflation data eased concerns about a second wave of price pressures. One additional rate hike this year is now the prevailing expectation. A resilient employment report could quickly revive speculation that the Fed may need to tighten more aggressively, setting the tone for the Dollar and Treasury yields.
The ECB flash CPI provides an early inflation reading that dictates European Central Bank policy trajectories. Recent survey data suggest inflation pressures continue to moderate, yet another upside surprise could strengthen the case for additional policy tightening ahead of the August meeting. Eurozone Services Sentiment for June actual was 3.2, exceeding the consensus of 2.5 and the previous reading of 2.2. The Eurozone M3 Money Supply year-over-year rate for May came in at 3.20%, surpassing the consensus forecast of 2.70%. These deviations from expected thresholds serve as signals for traders monitoring liquidity and sentiment.
Markets appear content to wait for data capable of reshaping monetary policy expectations rather than responding to incremental headlines. Most substantial pairs remain within last week's ranges as investors reach a temporary equilibrium. Quarter-end positioning is giving way to a series of economic releases that will test expectations for the Fed, ECB, BoJ and RBA in quick succession.
Interpreting Tankan Survey and ISM Manufacturing Data
The Tankan survey defines Japanese business sentiment through quarterly diffusion indexes that signal Bank of Japan normalization readiness. Traders interpret ISM manufacturing data by analyzing the divergence between new orders and inventory levels to forecast production shifts. Policymakers in Japan seek evidence that stronger business conditions and price dynamics provide support for a quicker pace of normalization. Asian equities ended mixed, with Japanese and South Korean shares little changed, reflecting investor hesitation before these critical releases.
Inventory overhangs pose a specific risk. Manufacturing activity has benefited in recent months from precautionary stockpiling during the disruption to Middle East shipping routes. Elevated inventories combined with softening new orders could signal that manufacturers are entering an inventory adjustment phase that weighs on production later this year. A high headline ISM number paired with rising inventories suggests caution rather than expansion. Market participants must weigh current sentiment against these lagging inventory metrics to avoid false breakouts. Capital flow direction this quarter depends on the interplay between Japanese sentiment and American industrial output.
Risks of Misreading Central Bank Hawkishness Signals
Hawkish signal misinterpretation occurs when traders mistake quarter-end liquidity thinning for genuine policy conviction, leading to premature positioning ahead of critical data. This error carries cost because central bank policy divergence defines the current environment, creating two-way volatility that directionless price action often obscures. Brent crude holding near USD 73 suggests investors view Middle East tensions as manageable, yet this stability masks the fragility inherent in waiting for Non-Farm Payrolls. Currency markets appear calm with the New Zealand Dollar, Pound Sterling, and Euro outperforming modestly, but these moves lack the momentum of a true trend. The absence of strong market moves today should not be mistaken for complacency.
Operators tracking central bank hawkishness must distinguish between technical range-bound trading and genuine shifts in monetary expectation. A false read on Fed tightening probabilities could trap used positions before the US employment report clarifies the trajectory. Investors appear to have reached a temporary equilibrium, with a series of economic releases poised to test expectations for the Fed, ECB, BoJ and RBA in quick succession. Domestic data sensitivity matters more than surface-level price stability.
Mechanics of Divergent Monetary Policy Across Substantial Economies
ECB Restrictive Stance Versus Fed and BoJ On Hold Policies
The European Central Bank hiked rates to combat energy shock inflation while peers paused operations. Federal Reserve and Bank of Japan officials shifted to an on hold policy because extended uncertainty surrounding the Iran war complicates domestic forecasting. This divergence forces traders to recalibrate yield curves as geopolitical risk overrides domestic inflation signals in substantial economies.
| Central Bank | Current Stance | Primary Driver |
|---|---|---|
| European Central Bank | Restrictive | Energy shock inflation |
| Federal Reserve | On Hold | Geopolitical uncertainty |
| Bank of Japan | On Hold | Geopolitical uncertainty |
Market participants often misread this pause as accommodation, yet the mechanism here is pure risk aversion rather than stimulus. The drawback of this wait-and-see approach is heightened volatility in currency crosses like USD/JPY when data conflicts with geopolitical headlines. Extended uncertainty surrounding the conflict has led to a sharp shift in views, with both central banks now expected to keep policy settings on hold. Liquidity conditions can become fragile when holiday-thinned trading windows coincide with substantial data releases, increasing intervention risks for pairs like USD/JPY. The defining feature for short-term rates in 2026 remains this policy split, creating two-way volatility that demands strict position sizing. Traders must monitor the Eurozone Flash CPI for clues on whether the ECB maintains its aggressive posture against stagflationary pressures.
Translating ISM Manufacturing Data and NFP into Rate Decisions
Traders convert ISM Manufacturing Survey readings into Federal Reserve probability weights by analyzing the gap between new orders and inventories. Elevated stockpiles combined with softening demand often signal an impending production slowdown, reducing the likelihood of aggressive tightening. Investors will examine the relationship between new orders and inventories to detect early signs of an inventory adjustment phase. This technical decomposition matters because a resilient labor market could otherwise revive speculation of more aggressive policy moves.
The US Non-Farm Payrolls report serves as the primary validation mechanism for these manufacturing signals. Markets have scaled back expectations for aggressive Federal Reserve tightening after June's PCE inflation data eased concerns. However, a single strong employment print could instantly recalibrate the forecast for one additional rate hike this year.
| Indicator | Bullish Rate Signal | Bearish Rate Signal |
|---|---|---|
| ISM New Orders | Expansion relative to inventories | Contraction relative to inventories |
| Non-Farm Payrolls | Resilient employment print | Softening labor market |
Tracking central bank hawkishness requires correlating these domestic data points with shifting policy forecasts. The cost of misalignment is immediate volatility, as seen when gold faced pressure near $4,100 per ounce due to high inflation risks. Regarding how RBA meeting minutes influence rates, the text notes policymakers maintain a hawkish tone despite unchanged rates, leaving markets divided on an August increase. Geopolitical uncertainty can override domestic data, forcing both the Fed and Bank of Japan to keep policy settings on hold regardless of local economic strength. Traders must therefore distinguish between data-driven policy shifts and uncertainty-driven pauses to fix misaligned market expectations effectively.
Stagflationary Trends Driving EUR/USD Volatility Near 1.1400
Rising hydrocarbon costs force the European Central Bank to upgrade inflation forecasts while downgrading growth, creating a classic stagflationary trap. This divergence sharpens as energy shock inflation compels tighter policy in Europe while the Federal Reserve pauses amid geopolitical uncertainty. The EUR/USD pair attempted a tepid bounce above the 1.1400 level, yet traders remain skeptical of sustained momentum without clearer Fed guidance. Gold prices settled near $4,016 per ounce following a 1.78% drop, illustrating how ceasefire hopes temporarily override safe-haven demand during Doha talks.
| Factor | Eurozone Impact | US Impact |
|---|---|---|
| Inflation Driver | Energy prices | Sticky services |
| Policy Response | Restrictive hike | On hold |
| Growth Outlook | Downgraded | Resilient |
Market participants often misalign expectations by assuming synchronized global tightening, ignoring that energy shocks affect production capacity differently than demand-pull pressures. Spreads widen when data contradicts the consensus view of a unified fed vs ecb policy outlook. The ECB distinguished itself as the first among global peers to hike interest rates in response to the energy shock, creating a complex flexible where upgrading inflation forecasts coincides with downgrading growth outlooks.
Applying Technical Analysis to Identify Intervention Risks and Reversals
Defining USD/JPY Intervention Risk at 162.00
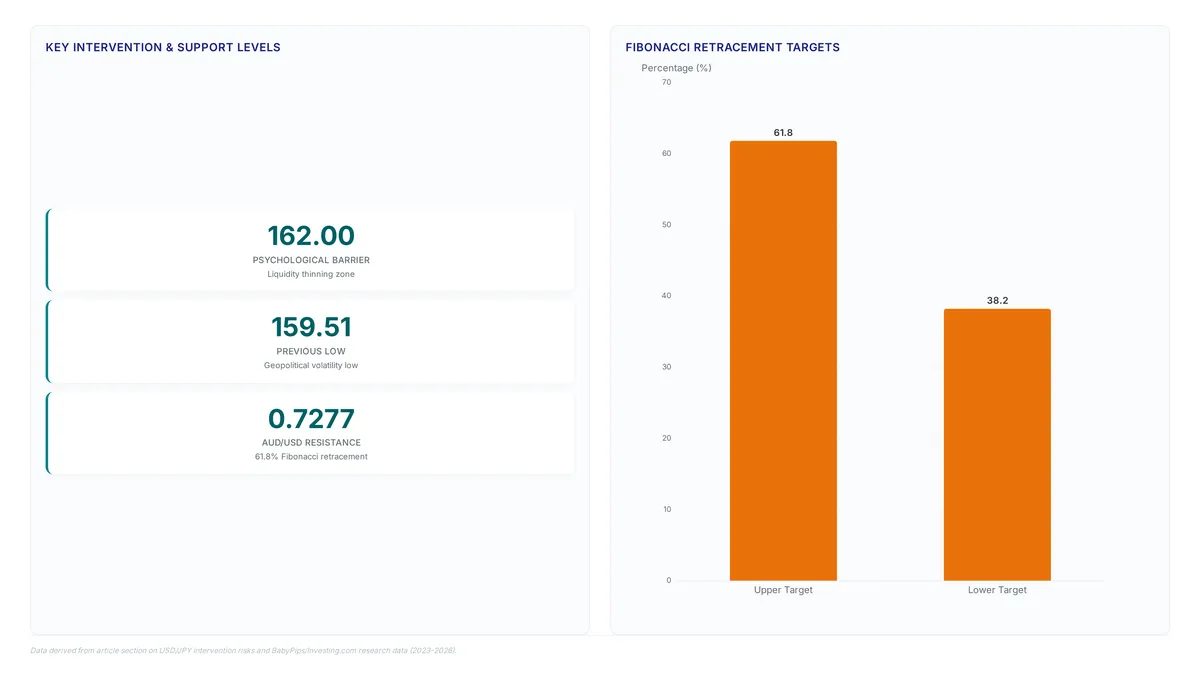
Liquidity thins and government action becomes probable as USD/JPY climbs toward 162.00. This specific price level functions as a psychological barrier where authorities face intense pressure to prevent disorderly market moves. Geopolitical volatility surrounding US-Iran tensions previously drove the pair to a low of 159.51 before a risk-on recovery, illustrating how quickly sentiment can shift. The dollar's recovery faces constraints from potential intervention while simultaneously being supported by restrictive Federal Reserve policy expectations. Patience from officials before substantial data releases may simply delay an inevitable, sharper correction once liquidity evaporates. Authorities appear reluctant to intervene before the jobs report. That hesitation could increases volatility if liquidity disappears post-release.
Using MACD and Fibonacci to Spot Reversals
Daily MACD bearish divergence signals a potential medium-term top when price fails to sustain above key resistance. The AUD/USD pair rates this mechanic after rejecting the 61.8% retracement level near 0.7277, indicating sellers are regaining control. Momentum often fades before price action confirms the reversal. A confirmed break below support targets the 38.2% Fibonacci extension, offering a precise objective for downside moves. Operators must wait for candle closes beyond these levels rather than anticipating the break. Relying solely on oscillators without volume confirmation increases the risk of false signals during low-liquidity holiday sessions.
- Watch for divergence between price highs and indicator lows.
- Confirm breaks with significant volume spikes.
- Avoid entries during pre-holiday thinning.
- Respect the 61.8% retracement as a hard ceiling.
- Target the 38.2% extension on breakdowns.
Pitfalls of Overbought Signals Before NFP Data
Relying on overbought signals before the Non-Farm Payrolls report invites false reversals as liquidity evaporates. Authorities demonstrate marked reluctance to intervene pre-data. Intervention risk escalates sharply once figures release into holiday-thinned markets. This flexible creates a trap where technical exhaustion mimics a trend change, only for volatility to spike against premature positions. A prevailing forecast suggests that the ability to intervene is constrained, influencing the dollar's recovery trajectory during weeks of high geopolitical tension. Traders ignoring this timing mismatch often face whipsaws when official flows return. The core problem with technical signals here is their failure to account for the structural vacuum preceding substantial data. An oscillator may flash extreme. The absence of action until the print means price can remain irrational longer than capital allows. Operators must distinguish between genuine exhaustion and the calm before a policy-driven storm. Momentum indicators lack context for scheduled liquidity gaps. Markets price in one Fed hike. The jobs report could determine if consensus shifts toward more aggressive tightening.
Strategic Positioning Decisions Ahead of High-Impact Data Releases
Defining Inventory Overhang Risks Before NFP
Precautionary stockpiling masks a collapse in genuine demand within ISM Manufacturing data, creating an inventory overhang. This distortion complicates decisions on whether to position before non-farm payrolls because elevated warehouse levels often precede sharp production cuts. Recent disruptions to Middle East shipping routes forced manufacturers to hoard goods, artificially inflating new orders ahead of the report. Softening orders against rising stocks in the ISM Manufacturing Survey signals an upcoming inventory adjustment phase. Such a shift would likely depress hiring figures more severely than consensus estimates anticipate. Market participants pricing one rate hike face asymmetric risk if the employment report captures this lagged production collapse. A mechanical link exists between inventory cycles and labor data. A headline miss could trigger disproportionate volatility in currency pairs. Investors must verify the inventory-to-sales ratio before committing capital to directional bets on the dollar.
Pre-NFP Positioning Versus Waiting for Clarity
Entering trades before the jobs report bets on a specific deviation from the consensus view rather than market direction. Speculators choosing to position early face immediate gamma exposure as liquidity thins ahead of the Independence Day holiday, creating a narrow window for error. Waiting for clarity eliminates execution risk but often sacrifices entry price once the algorithmic reaction completes.
| Strategy | Primary Advantage | Critical Risk |
|---|---|---|
| Pre-Event Entry | Captures full volatility expansion | Mispricing of Fed tightening probability |
| Post-Event Wait | Confirms trend direction | Slippage during liquidity gaps |
| Hedged Approach | Limits downside variance | Premium decay from implied volatility |
The prevailing market expectation currently prices one additional rate hike. A resilient employment print could revive speculation for more aggressive Federal Reserve tightening. This binary outcome means pre-NFP positioning effectively acts as a used vote on the Fed tightening consensus shifting upward. Traders ignoring this asymmetry risk holding long USD positions that become obsolete if inventory adjustments signal slower growth. The cost of waiting is measurable. Sudden moves often gap through technical levels, leaving late entrants chasing price. Early entry offers superior risk-reward ratios only if the trader correctly anticipates the data surprise. Waiting guarantees correct direction but often at inferior valuations. The constraint lies in timing the release correctly.
AUD vs NZD Performance in Directionless Markets
The Australian Dollar lagged while substantial European indices traded modestly lower, revealing a divergence in regional risk sentiment. Unlike its trans-Tasman peer, the New Zealand Dollar outperformed as traders positioned for potential Reserve Bank hawkishness. This split highlights how directionless markets increases subtle shifts in central bank expectations rather than broad geopolitical shocks.
| Metric | Australian Dollar | New Zealand Dollar |
|---|---|---|
| Recent Price Action | Middle of the pack | Modest outperformance |
| Primary Driver | RBA minutes ambiguity | Rate hike speculation |
| Risk Profile | Inventory overhang fears | Commodity support |
Traders misaligned with market expectations often overlook that quarter-end positioning suppresses volume, making currency pairs prone to sharp, uneven moves on minimal data. Liquidity is the constraint here. Without a clear catalyst like the upcoming Non-Farm Payrolls, the AUD vs NZD cross remains trapped until one central bank signals a definitive path. A prevailing forecast suggests that the Bank of Japan's ability to intervene in currency markets is constrained, influencing the dollar's recovery trajectory during weeks of high geopolitical tension, which indirectly supports the NZD via carry trade dynamics. Premature entry exposes operators to whipsaw price action as algorithms react to thin order books. Operators should wait for the ISM Manufacturing data to confirm if inventory adjustments will force the RBA to pause, clarifying the AUD downside risk. Numbers 33847 and 290626 appear in the source metadata linking these geopolitical threads.
About
Sofia Mendes serves as the Broker Reviews & Trading Education Editor at ForexCFD.top, where she oversees the platform's rigorous methodology for evaluating regulated brokers and developing trading curricula. While her daily work focuses on broker due diligence and risk management, this expertise is critical when analyzing central bank decisions that drive market volatility. As the Fed, ECB, BoJ, and RBA convene, their policy shifts directly impact the spreads, execution quality, and funding conditions Sofia evaluates in her broker reviews. Her deep understanding of how macroeconomic events affect retail trading environments allows her to contextualize high-stakes monetary policy for ForexCFD.top's global audience. By connecting central bank actions to practical trading realities, she ensures readers understand not just the news, but its tangible effect on trading costs and risk exposure. This perspective bridges the gap between complex economic data and the regulated trading infrastructure necessary for retail participants.
Conclusion
Scalping volatility around central bank decisions breaks when liquidity evaporates during quarter-end windows, turning minor data deviations into disproportionate price spikes. The operational cost of premature positioning is no longer just slippage but total capital misallocation as algorithms hunt stops in thin order books. Traders must recognize that divergent regional policies create a trap where waiting for confirmation often yields improved risk-reward ratios than guessing the initial surprise. The market rewards patience over speed when central bank decision clarity remains elusive.
Commit to a strict rule of ignoring initial price reactions until volume confirms the trend direction. This approach prevents entering trades based on false breakouts that frequently occur when geopolitical headlines clash with economic data. Your specific first action this week is to map the Fibonacci extension levels on the AUD/NZD cross and set alerts only for confirmed breaks beyond these technical zones. Do not execute trades based on headline numbers alone. Wait for the ISM Manufacturing data to validate whether inventory adjustments will force a policy pause. By anchoring your entries to confirmed technical breaks rather than speculative forecasts, you align your strategy with actual market mechanics rather than noise.
Frequently Asked Questions
Unexpected inflation data can force policymakers to tighten monetary policy more aggressively. The Eurozone M3 money supply recently hit 3.20%, beating the 2.70% forecast to signal lingering liquidity pressures.
Gold prices often drop when ceasefire talks reduce immediate geopolitical fears among global investors. Settlements near $4,016 per ounce followed a 1.78% decline as risk sentiment improved markedly.
Traders watch for price action rejecting key Fibonacci levels to confirm changing market momentum. A recent move rejected the 61.8% retracement level, suggesting sellers remain active at that specific resistance point.
Elevated inventories combined with softening new orders often signal an upcoming adjustment phase. This dynamic warns that production could weigh heavily on later economic growth figures for the year.
A confirmed break below major support targets deeper Fibonacci extensions for asset prices. This specific mechanic suggests a move toward the 38.2% extension if current bearish pressure continues unabated.
References