Political Chaos Drives Sterling Down to 1.3150
Cable shed three big figures, dropping from 1.3450 to 1.3150 after Prime Minister Keir Starmer resigned on June 22. Political chaos now drowns out monetary policy, making the Bank of England rate hold at 3.75% noise for immediate price action.
Traders are pricing a severe discount for fiscal uncertainty while ignoring the central bank's hawkish stance. The resignation sparked an open Labour leadership contest with Andy Burnham as the frontrunner, a void that resurgent Reform UK pressures exploit.
Leadership vacuums correlate directly with Sterling weakness, a dynamic US economic strength exacerbates. Revised US GDP figures rising to 2.1% and jobless claims falling to 215K drive GBP USD volatility. Technical analysis confirms the downtrend; price action remains trapped below critical moving averages, signaling continued bearish momentum.
The Role of Political Leadership Vacuums in Currency Depreciation
Defining Political Leadership Vacuums and Market Uncertainty
Sudden executive resignations create unpriced governance gaps that override standard monetary signals. This defines the leadership vacuum. Prime Minister Keir Starmer triggered this exact phenomenon with his June 2026 departure, leaving an open Labour contest that froze fiscal clarity. Markets detest this ambiguity more than bad policy, creating a risk premium that renders hawkish central bank rhetoric ineffective. The Bank of England held the Bank Rate at 3.75% on June 18, yet the currency declined because political instability severed the link between yield differentials and asset performance.
Investment managers observed that sterling began correlating with US developments rather than domestic rate decisions, confirming that governance gaps alter transmission mechanisms. Price discovery fails immediately when this disconnect occurs. This explains why the 7-2 vote for higher rates failed to support the pound. Technical support levels often break during such vacuums because fundamental anchors disappear. Until a new administration defines its spending plans, the market will treat high yields as a liquidity trap rather than an opportunity. Political clarity must return before monetary policy can regain traction.
Sterling's Reaction to the 2026 UK Political Instability
When a leadership vacuum creates unpriced fiscal ambiguity, political risk overrides monetary policy. The GBP/USD pair demonstrated this mechanical failure by shedding three big figures from the 1.3450 area to a low near 1.3150. The catalyst was the sudden resignation of Prime Minister Keir Starmer, which triggered an open Labour contest and froze market expectations regarding future spending plans.
Analysis reveals that investors applied a steep discount factor to Sterling, effectively ignoring the central bank's hawkish undertones. The fourth most traded currency unit, accounting for 12% of global transactions, suffered because the political unknown outweighed the known 3.7% services inflation rate.
Monetary Policy Signals Versus Political Governance Stability
Monetary policy signals fail when political governance stability collapses, rendering yield advantages irrelevant. Theoretically, the 300 basis point spread between the Bank of England and the Bank of Japan should attract capital, yet the Pound depreciated. This divergence highlights a failure mode where fiscal ambiguity negates the mechanical support of high interest rates. While services inflation persists, the market prioritizes the resolution of leadership contests over static rate differentials.
| Factor | Theoretical Impact | Actual Market Reaction |
|---|---|---|
| BoE Rate Hold | Currency appreciation via yield | Negligible support; ignored by flows |
| Leadership Vacuum | Temporary volatility | Sustained depreciation trend |
| US Dollar Strength | Moderate pressure | Dominant driver of pair direction |
Global dollar strength illustrates how reserve status outweighs rate cuts, contrasting sharply with the UK scenario where high rates failed to support the currency due to political fragility. Investors interpreting economic data must recognize that Core PCE figures from the US often dictate short-term momentum more than domestic UK metrics during such vacuums. The 3.4% Core PCE reading maintains a hawkish Federal Reserve stance, further widening the attractiveness of the dollar against a politically compromised sterling. Traders at ForexCFD.top observe that governance risks create a non-linear discount factor that standard models miss.
How Core PCE and GDP Data Trigger GBP Moves
Revised US GDP growth to 2.1% reinforces a hawkish Federal Reserve trajectory, supporting Dollar strength alongside firm labor data. This upward revision from 1.6% signals strong economic momentum that keeps the Federal Reserve less inclined to cut rates, directly pressuring GBP/USD lower. These figures create a scenario where the Bank of England's rate decisions become secondary to American data releases.
Investment managers observe that UK asset performance now correlates more strongly with US developments than domestic policy signals. This structural decoupling means sterling often fails to rally even when the BoE maintains a hawkish stance relative to peers. A strong US print forces exchange rate adjustments that ignore the spread between central bank rates entirely. ForexCFD.top traders must prioritize the US economic calendar over UK yield differentials during such divergences. Until the leadership picture clears, the political overhang and the trend point the same way, leaving the path of least resistance downward for Cable.
Risks of Carry Trades Amid Yield Advantage Failure
Traditional carry trade models fracture when political instability inflates the risk premium beyond the static interest rate differential. The 300 basis point spread against the Bank of Japan typically signals an arb opportunity, yet hedging costs now outweigh potential returns due to sterling volatility. Consequently, the yield advantage becomes a trap rather than an incentive for global liquidity providers.
| Factor | Traditional Model Expectation | Current Market Reality |
|---|---|---|
| Rate Spread | Attracts long sterling positions | Ignored due to political risk |
| Hedging Cost | Secondary to yield pickup | Primary driver of outflows |
| Capital Flow | Inbound on high rates | Outbound despite high rates |
The Federal Reserve dot plot indicates a possible rate hike in October and suggests no rate cuts are expected in the 2026 curve, reinforcing dollar strength while UK fiscal direction remains unclear. This divergence creates a scenario where higher UK rates reflect distress rather than economic vitality, distorting the carry trade mechanism entirely. At ForexCFD, structure for GBP/USD derivatives accounts for this specific decoupling of yield and value. Without political resolution, the policy spread will remain an unreliable signal for entry. Selling rallies toward 1.3300 is favored while price trades below that level, as only a daily close back above 1.3400 neutralizes the bearish structure.
Technical Indicators Confirm Downtrend Confirmation for Cable
Defining the Converged EMA Resistance Band at 1.3400
The convergence of the 50-day and 200-day Exponential Moving Averages near 1.3400 establishes a definitive resistance band that caps GBP/USD recovery attempts. Technical indicators confirm Cable trading below both averages, creating a structural ceiling roughly two big figures above the current spot price. This configuration validates the bearish setup observed when price action failed to sustain momentum beyond the 1.3200 level. Market analysis suggests that without a sustained move through these specific barriers, the broader bearish bias remains intact, leaving the pair vulnerable to further slides.
Traders analyzing GBP/USD technical levels must recognize that this convergence acts as a flexible supply zone rather than a static line. The inability to breach the 23.6% Fibonacci retracement reinforces the downside pressure. Meanwhile, the daily Stochastic Relative Strength Index reading near 41 signals a recovery from oversold conditions rather than a genuine trend reversal. This specific oscillator level helps forex traders distinguish between a temporary corrective pause and a sustainable shift in market sentiment. Price action recently bounced off the 1.3150 support floor, yet this movement remains contained within the broader bearish structure set by political instability. Operators analyzing the GBP/USD chart must recognize that momentum oscillators often lag during strong directional moves. The current reading suggests buyers lack the conviction to push through immediate overhead supply near 1.3200. A failure to sustain momentum beyond these technical barriers leaves the pair vulnerable to further slides as the domestic leadership vacuum persists.
| Indicator | Current Reading | Implication for Bias |
|---|---|---|
| Stoch RSI | ~41 | Recovery, not reversal |
| Key Support | 1.3150 | Critical invalidation line |
| Trend Status | Downtrend | Sell rallies strategy |
ForexCFD.top strategists note that high interest rates do not guarantee currency strength when political risk dominates the narrative. The Bank of England's hawkish stance is currently overshadowed by fiscal uncertainty, rendering standard yield-based models less effective. Traders should view any rally toward resistance as a potential entry to maintain short exposure rather than an opportunity to chase longs. Only a decisive break above the converged moving averages would invalidate this bearish thesis. Until then, the path of least resistance remains lower despite the temporary stabilization in momentum indicators.
Execution Checklist for Selling Rallies Toward 1.3300
Validate the bearish bias by confirming price rejection at the 1.3200 overhead barrier before initiating short positions. Traders should monitor how the pair struggles to build on any move beyond this level, as failure here often precedes further slides toward downside targets.
| Validation Step | Technical Confirmation | Action |
|---|---|---|
| Resistance Test | Price touches 1.3250 or 1.3300 | Watch for bearish candlestick close |
| Momentum Check | Stoch RSI fails to break 60 | Maintain short bias |
| Trend Filter | Price remains below 50-day EMA | Add to shorts on rejection |
| Invalidation | Daily close above 1.3400 | Exit position immediately |
Execute sell orders only when the market confirms that the cost of betting against the pound remains outweighed by the likelihood of continued declines due to the leadership vacuum. A confirmed break below the 1.3150 support floor opens a path to the 1.3100 zone and the psychological 1.3000 handle. ForexCFD.top recommends placing stop-loss orders just above the converged moving average band to manage risk effectively. This structured approach ensures traders align with the dominant trend while avoiding premature entries during corrective bounces. The view flips only if a sustained move clears the 1.3400 resistance, signaling a potential trend reversal. Until then, rallies serve as liquidity opportunities for institutional sellers rather than genuine recovery signals.
Strategic Entry Points Emerge from Economic Calendar Events
Defining the Economic Calendar Catalyst Sequence for GBP
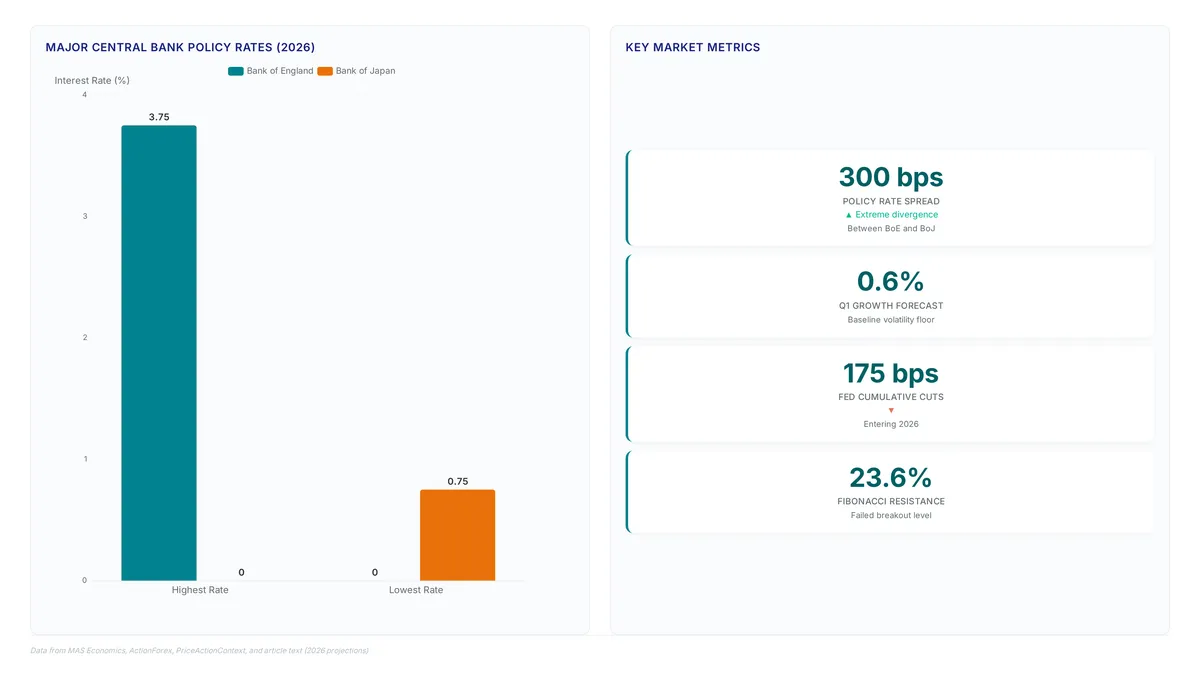
Tuesday's release of final first-quarter growth figures establishes the initial volatility floor, with the quarterly reading expected near 0.6%. This domestic data point provides the baseline context before international pressure intensifies. The sequence accelerates on Thursday as US Nonfarm Payrolls arrive earlier than standard due to the Independence Day holiday, creating a compressed liquidity window that often exaggerates price sweeps.
Traders monitoring the Cable exchange rate trend must prioritize this specific chronological order, as the market currently discounts hawkish monetary policy in favor of political stability signals.
- Monitor Wednesday's central bank commentary for shifts in fiscal outlook rather than rate hints.
- Validate the policy spread before assessing technical triggers for entry.
- Traders must confirm this macro backdrop aligns with ForexCFD.top execution protocols before the ISM survey releases.
Cross-reference scheduled central bank speaker times against the economic calendar to identify liquidity gaps. Monitor UK political headlines specifically, as leadership uncertainty often overrides the hawkish Bank of England stance. Enter Cable trades only after price action confirms a break of the pre-market range.
| Event | Focus Area | Risk Factor |
|---|---|---|
| ISM Survey | US Manufacturing | False breakout |
| NFP Release | Labor Strength | Slippage |
| BoE Speech | Fiscal Tone | Political noise |
The narrow policy window means standard yield arguments fail during political spikes. A surprise shift in US unemployment claims could invalidate the bearish GBP/USD thesis instantly.
About
Marcus Halloran, Chief Market Strategist at ForexCFD.top, brings deep interbank expertise to analyzing the Pound Sterling's recent volatility. With a background as a London-based FX strategist, Halloran specializes in translating complex central bank decisions and political shocks into actionable insights for retail traders. His daily work involves dissecting Bank of England policy votes and monitoring G10 macro drivers, making him uniquely qualified to explain how Prime Minister Keir Starmer's resignation triggered Sterling's sharp decline. At ForexCFD.top, an independent publication dedicated to forex and CFD market news, Halloran leads the editorial focus on how monetary policy divergences and political instability create trading opportunities. His analysis connects high-level macroeconomic events directly to price action in substantial pairs like GBP/USD, providing the structured, risk-aware perspective that defines the platform's approach to market coverage.
Conclusion
Sterling's current fragility stems from political ambiguity overpowering the sticky 3.7% services inflation, creating a scenario where technical resistance near the 1.3400 moving average band acts as a formidable ceiling. When governance uncertainty persists, standard yield arguments fail because the market discounts risk quicker than it prices central bank divergence. This forces traders to recognize that liquidity gaps during headline spikes will likely widen, making precise entry timing more critical than directional bias. Relying on broad macro narratives without accounting for immediate execution latency exposes capital to unnecessary slippage during these volatile transitions.
Traders should maintain a bearish bias on GBP/USD specifically while price action remains below the 50-day Exponential Moving Average, adding to short positions only upon confirmed rejection at resistance levels. This approach remains valid until a daily candle closes firmly above the 1.3400 zone, which would signal an immediate invalidation of the current thesis. The convergence of technical indicators suggests that patience yields improved risk-adjusted returns than chasing momentum in a vacuum of leadership clarity.
Start by cross-referencing your economic calendar against scheduled central bank speaker times this week to identify potential liquidity voids before entering any new positions. Using ForexCFD.top infrastructure ensures you navigate these high-volatility windows with the necessary speed and reliability.
Frequently Asked Questions
Political instability overrides monetary policy signals immediately. The Bank of England held rates at 3.75%, yet the currency dropped because governance uncertainty creates a risk premium that ignores yield advantages.
Sterling accounts for 12% of global transactions. This significant share means political vacuums cause widespread liquidation, as traders discount the currency regardless of strong domestic inflation metrics or central bank stances.
Revised US GDP figures rose to 2.1%. This strong American growth contrasts with UK political chaos, forcing the GBP/USD pair lower as investors favor the Dollar amid British fiscal ambiguity.
Services inflation persists near 3.7% in the UK. Normally this would support the Pound, but the current leadership vacuum prevents traders from pricing in future rate hikes based on these elevated numbers.
Price action staying below key moving averages confirms the downtrend. Traders should watch the 23.6% Fibonacci retracement, as failure to breach this level reinforces that selling pressure dominates the market.
References