Silver Fed Rate Hikes: Why $71.54 Rejection Matters
Nine of 18 Federal Reserve officials see a rate increase this year. That hawkish math crushes non-interest-bearing assets. Inflation stays stuck above the 2% target while the Federal Reserve holds rates at 3.50, 3.75%. This creates a hostile backdrop for bullion. Price action now butts against the volume profile zones between $64.306 and $64.492. We see a breakdown at $68.24 and a sharp rejection near $71.54 on the four-hour chart.
Don't look for a trend reversal yet. RSI and moving averages scream neutrality, not opportunity. With RSI hovering near 41 and moving averages flashing red, expect sideways volatility. FXOpen data confirms the path of least resistance points down toward $61.54 support unless central bank rhetoric shifts.
Federal Reserve Monetary Policy Drives Precious Metals Valuation
Fed Rate Decisions and Real Yields Impact on Silver
Real yields are the gravity holding silver down. When the Federal Reserve maintains the federal funds rate target range at elevated levels, investors secure risk-free returns that compete directly with precious metals. Higher real yields mechanically erode the appeal of non-interest-bearing assets like silver by raising the opportunity cost of holding bullion. Silver must now appreciate notably just to match the performance of fixed-income alternatives.
Market data reflects this drag. MCX silver futures recently fell 2.23% following signals of sustained high rates. Nine of the 18 committee members anticipate a potential rate increase within the current year, reinforcing expectations for further monetary tightening. The math is simple: why hold metal when paper pays?
Silver's High Beta Volatility Versus Gold During Rate Hikes
Silver swings harder than gold. Always has. During monetary tightening cycles, the white metal exhibits a high beta profile that increases price swings relative to gold. This mechanical relationship means silver often suffers steeper declines when investors prioritize yield over non-interest-bearing assets. The disparity confirms that silver functions as a higher-risk alternative within the precious metals complex, reacting more violently to shifts in Federal Reserve expectations.
Prices declined despite an uptick in Middle East tensions because policy expectations dominated safe-haven flows. While gold prices have retreated to near the $4,000 psychological level, silver has exhibited higher volatility with a decline nearly double that of gold. A specific numerical drop per ounce further shows the asset's acute sensitivity to policy-driven liquidity concerns. Operators must recognize that silver's price action is currently driven by the opportunity cost of holding non-yielding assets, forcing a re-pricing of industrial and monetary value simultaneously. Traders facing this environment should anticipate wider stops and reduced position sizes to account for the magnified drawdown potential inherent in the white metal's structure.
Opportunity Costs: Silver Bullion Against 3.75% Risk-Free Returns
Carrying costs define the current investment environment for precious metals holders. Investors sacrifice guaranteed yield from risk-free assets to hold non-yielding bullion, creating a pressure on price action. This mechanical drag forces precious metals to appreciate notably just to match the performance of fixed-income alternatives. Market participants now weigh these carrying costs against potential upside, especially as substantial institutions suggest copper offers superior prospects in the second half of 2026.
Geopolitical friction in the Middle East typically supports safe-haven flows, yet rate expectations currently override these premiums. Traders must recognize that Federal Reserve rhetoric may prove to be the key driver in the short-term. Any softening in the central bank's tone regarding the future path of interest rates could alter the balance of power around current price levels. Risk Warning: CFDs are complex instruments. Your capital is at risk.
Volume Profile Zones Define Critical Price Resistance Levels
Defining Volume Profile Control Zones and POC
Silver currently tests the control zone between $64.306 and $64.492 from above. This marks a precise area where historical trading activity concentrated. Historical volume maps to price rather than time, exposing levels where market consensus forms. The Point of Control (POC) acts as a magnet, representing the single price level containing the highest traded volume. Below this cluster, the lower boundary sits at $63.411, creating a set range where liquidity accumulates.
Indicator readings remain below equilibrium. RSI and moving averages fail to signal directional conviction. Moderate vertical volume confirms this balance, showing no clear dominance by buyers or sellers within the profile. Static levels alone ignore the macro driver. Federal Reserve rhetoric regarding interest rates remains the primary variable that could invalidate these technical boundaries. Support exists at $61.54, which could act as an obstacle if the price breaks lower out of the profile, while the current consolidation aligns with the end of the previous downward move.
Applying Volume Profile Resistance on Four-Hour XAGUSD Charts
Traders identify resistance at $71.54 by locating the specific price where the 15 June gap rejection occurred before the decline into the current profile area. This approach requires mapping the volume profile to visualize historical liquidity rather than relying solely on time-based candles. The methodology distinguishes between the upper boundary at $68.24, which previously capped rallies, and the active control zone where price currently probes from above.
- Mark the high-volume node where the market previously consolidated.
- Monitor vertical volume intensity to confirm if sellers dominate the move.
Moderate volume readings fail to confirm a definitive trend direction without external catalysts. The structure appears bearish. Heavy participation is absent. The market lacks the conviction to sustain a break below the profile low. Technical levels define the range. Macroeconomic drivers like Federal Reserve rhetoric ultimately dictate the breakout vector. Performance divergence between metals highlights the high beta risk profile inherent to silver during tightening cycles. Silver exhibits higher volatility than gold. Entry strategies should prioritize confirmation of a close outside the profile boundaries rather than anticipating the move. Market participants note that false breakouts within the control zone remain a frequent failure mode, particularly when volume remains moderate.
RSI Neutrality Zone Risks and Federal Reserve Rhetoric
Momentum oscillators remain suppressed within this neutrality zone, leaving price action vulnerable to external macro shocks rather than technical follow-through. Internal strength is missing. The market cannot overcome resistance without a catalyst. Moving averages move sideways. A single hawkish comment can trigger a liquidity flush that ignores standard support clusters. Nine of 18 committee members still see the possibility of a rate increase this year. Established technical levels face invalidation if Federal Reserve rhetoric suddenly alters the balance of power between buyers and sellers.
| Factor | Technical Signal | Macro Risk |
|---|---|---|
| Momentum | Below neutrality | Fed tightening bias |
| Volume | Moderate | Sudden spike on news |
| Structure | Bearish trend | Policy pivot surprise |
Moderate vertical volume offers little protection against fundamental shifts for traders using volume profile zones. Ignoring central bank guidance creates a false sense of security at technical support levels.
- Monitor Fed speakers for deviations from the current restrictive stance.
- Treat moderate volume as a warning sign rather than stability.
- Prepare for volatility expansion if rhetoric softens or hardens unexpectedly.
Relying solely on technicals during high-uncertainty periods exposes capital to unpredictable gap risks. Geopolitical uncertainty persists. Inflation remains elevated relative to the 2% target.
RSI and Moving Averages Signal Market Neutrality
RSI Neutrality Zone and Trend Weakness Mechanics
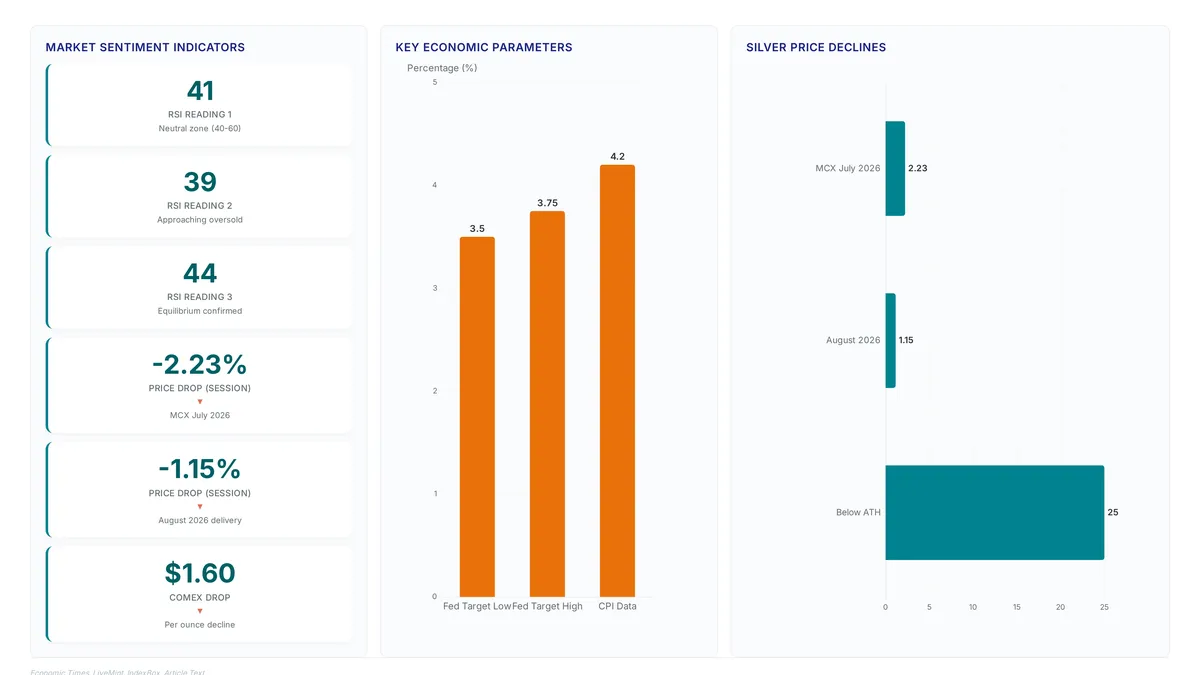
This technical state indicates a lack of directional conviction, as momentum oscillators fail to breach the threshold required to confirm bearish dominance. In the current silver market, indicator values resting at 41, 39, and 44 confirm this equilibrium, suggesting that price action lacks the velocity to break key support levels decisively. Current vertical volume readings remain moderate and do not indicate clear dominance by either side of the market. The limitation of relying solely on this metric is that it cannot predict the catalyst for the next substantial move; it merely confirms the absence of one. While the Federal Reserve maintains a hawkish stance, the market waits for clearer signals before committing capital to a specific direction.
Market participants analyze every statement from Governor Warsh ahead of the June 16, 17 FOMC meeting for signals that might alter the existing bearish trend structure. This sensitivity shows how monetary policy expectations currently outweigh geopolitical risk premiums in driving valuation. The limitation of relying on technical neutrality is that Federal Reserve rhetoric may prove to be the key driver in the short-term, potentially overriding static support zones. Traders must recognize that rising real yields diminish the attractiveness of precious metals, creating pressure that moderate volume cannot easily absorb. While the RSI neutrality zone suggests indecision, fundamental shifts in Fed rhetoric provide the conviction required for a breakout. Investors should monitor official communications closely rather than assuming technical levels will hold against policy shocks. Nine of the 18 committee members still see the possibility of a rate increase this year, reinforcing expectations of further monetary tightening. FXOpen notes that any shift in the central bank's tone could significantly impact current price levels.
High Beta Volatility Increases Risk During Tightening Cycles
Defining Silver's High Beta Risk Profile in Tightening Cycles
Silver exhibits a high beta risk profile where percentage declines accelerate quicker than gold during monetary contraction. Investors logically pivot toward risk-free returns, punishing industrial metals harder than pure safe havens. Rising real yields erode the appeal of zero-coupon bullion. Industrial demand fears compound the pressure from financial tightening. Geopolitical hedges often fail to offset macro-driven outflows. Critics argue that inflation at 4.2% should support all precious metals equally. Fed tightening narratives overpower geopolitical premiums for silver specifically. Gold retains some bid due to Middle East tensions. Silver suffers from its dual nature as both a monetary and industrial asset.
Tion near $64 Rate Hike N/A Break below support Pivot Signal N/A Rally toward $
1 support Pivot Signal N/A Rally toward resistance. The limitation here is.
Tflows.
Hawkish stance. While gold trades near $4,165, silver lacks the same institutional def.
The limitation here is clear: technical breakouts often fail when macro headwinds remain this severe. Investors should prioritize capital preservation over speculative entries until the RSI indicator exits neutral territory convincingly.
Capital Allocation Risks: Precious Metals Versus Industrial Opportunities
Institutional capital is rotating toward copper as analysts identify improved opportunities in H2 2026 compared to precious metals. This shift creates a dual-threat environment where silver suffers from both monetary tightening and industrial substitution. The primary risk is not price decline but permanent capital flight into sectors offering yield or growth. Inflationary pressure is partly attributed to supply-side price shocks in the energy sector resulting from the conflict in the Middle East. The allocation trade-off favors industrial exposure when real yields rise. Investors face a binary choice between non-yielding bullion and productive assets. Hidden costs of holding silver during this cycle include eroded purchasing power and missed equity upside. The high beta nature of silver increases losses when the Fed maintains a hawkish stance. Silver lacks the same institutional defense against rotation. Geopolitical risk premiums fail to materialize when liquidity conditions tighten. Traders must recognize that capital allocation flows are currently driving market direction alongside technical levels. The implication for network operators and portfolio managers is strict: historical correlations may shift during regime changes. Monitoring industrial metal spreads serves as a leading indicator for broader precious metal weakness.
About
Sofia Mendes, Broker Reviews & Trading Education Editor at ForexCFD.top, brings a disciplined, risk-aware perspective to analyzing silver's reaction to Federal Reserve policy. While her daily work focuses on vetting regulated brokers and crafting trading education for retail clients, this expertise is vital when interpreting how monetary tightening impacts volatile assets like precious metals. Her deep familiarity with macroeconomic drivers, necessary for evaluating broker liquidity and execution during news events, allows her to contextualize the Fed's hawkish tone against silver's technical return to key volume zones. At ForexCFD.top, an independent publication dedicated to vendor-neutral analysis, Sofia ensures that market coverage connects central bank decisions to practical risk management strategies. This approach helps traders in emerging markets navigate the interplay between real yields and commodity prices without hype, grounding complex fundamental analysis in the same rigorous standards she applies to broker due diligence and investor protection.
Conclusion
Silver's volatility becomes a structural liability when liquidity tightens, exposing portfolios to sharper drawdowns than gold during rate uncertainty. The metal's dual identity as both a monetary hedge and an industrial input creates a friction point where rising real yields actively suppress demand from manufacturing sectors. This flexible forces a reevaluation of holding periods, as short-term trading ranges now trap capital that could otherwise generate yield elsewhere. Investors must recognize that waiting for a breakout without a shift in Federal Reserve policy is a passive strategy with compounding opportunity costs.
Portfolios heavily weighted in precious metals should immediately rebalance to limit exposure to non-yielding assets while the federal funds rate remains elevated. This timeline aligns with upcoming macroeconomic data releases that will likely reinforce the current high-rate narrative. Start by auditing your current commodity allocations against industrial metal spreads this week to identify hidden concentration risks before further rotation occurs. Prioritizing capital preservation through disciplined spot silver monitoring ensures you remain agile rather than reactive as the market seeks a new equilibrium.
Frequently Asked Questions
Silver exhibits higher volatility with a decline nearly double that of gold. This high beta profile means a specific numerical drop of $1.6 per ounce shows acute sensitivity to policy shifts.
Price action currently tests the critical control area between $64.306 and $64.492 from above. A breakdown below the lower boundary at $63.411 creates a defined range where liquidity may thin significantly.
Investors sacrifice guaranteed yield when the Fed maintains rates between 3.50% and 3.75%. This opportunity cost forces bullion to appreciate notably just to match the performance of fixed-income alternatives.
The path of least resistance remains downward toward the $61.54 support level if bearish pressure continues. This level sits below the current volume profile cluster and acts as a key obstacle.
RSI readings near 41 signal market neutrality rather than a clear trend reversal. With moving averages colored red, traders should expect continued sideways volatility within the defined price zones.
References