Trimmed mean signals rates stay high till 2027
Underlying inflation in Australia is set to peak at 3.7% in mid-2026. This trajectory dashes hopes for a swift return to the RBA's target range. Sticky core prices will force the Reserve Bank of Australia to hold a restrictive stance well into 2027, ignoring temporary headline relief. The gap between surface data and real price pressure creates a minefield for policymakers and borrowers.
Volatile fuel prices create a deceptive drag on headline figures. This masks the dangerous second-round pass-through of energy costs into the broader services sector. We must look past monthly fluctuations to see the structural forces keeping prices high. Temporary fuel excise extensions will only distort the quarterly picture further, muddying the signal for market participants.
The housing sector remains a primary inflation driver. Competition for labor and materials continues to push new dwelling costs higher. Data from NAB and Westpac shows that while automotive fuel prices may drop sharply, upward pressure from rent and construction inputs remains unabated. Ignoring these deep-seated drivers in favor of a softer headline number invites significant policy error.
The Divergence Between Headline and Trimmed Mean Inflation Metrics
Defining Trimmed Mean Inflation and Exclusion of Volatile Items
The RBA prefers trimmed mean inflation because it strips out extreme price swings in volatile categories like fuel. This statistical method exposes persistent price pressures that headline figures frequently hide during energy shocks. By removing specific volatile items, the calculation isolates core trends so policy decisions reflect genuine demand rather than temporary supply spikes.
Data from the first quarter of 2026 recorded a 3.5% year-over-year increase in this metric. This confirms sticky core prices despite falling energy costs. Such persistence forces the central bank to maintain a restrictive stance even when headlines suggest cooling. Reacting to transitory fuel drops risks underestimating entrenched services inflation. Excluding volatiles does not eliminate upside risk. Construction pipeline pressures and labor competition continue to drive new dwelling costs higher, feeding directly into the trimmed calculation.
Premature easing expectations often stem from a failure to distinguish these components. The approach has a limitation: lag. By the time the trimmed mean peaks, second-round effects have already embedded in contracts.
Applying Trimmed Mean Data to Interpret RBA Target Band Deviations
Current trimmed mean readings sit well above the RBA's 2-3% target band, signaling persistent domestic pressure. This metric represents an increase from 3.4% in April, contradicting the soothing effect of falling fuel costs on headline figures. Economists prioritize this core measure because it filters transient energy shocks that distort the broader price narrative.
A premature policy pivot based solely on headline drops would ignore the reality that underlying inflation is projected to peak near 3.7%. Such a trajectory keeps real interest rates effectively lower than intended if the cash rate remains static at 4.35%. Fixed-income portfolios face specific operational risks from duration miscalculations caused by this divergence.
Fuel Drag and Second-Round Pass-Through Mechanisms
Fuel Price Mechanics in Headline CPI Calculations
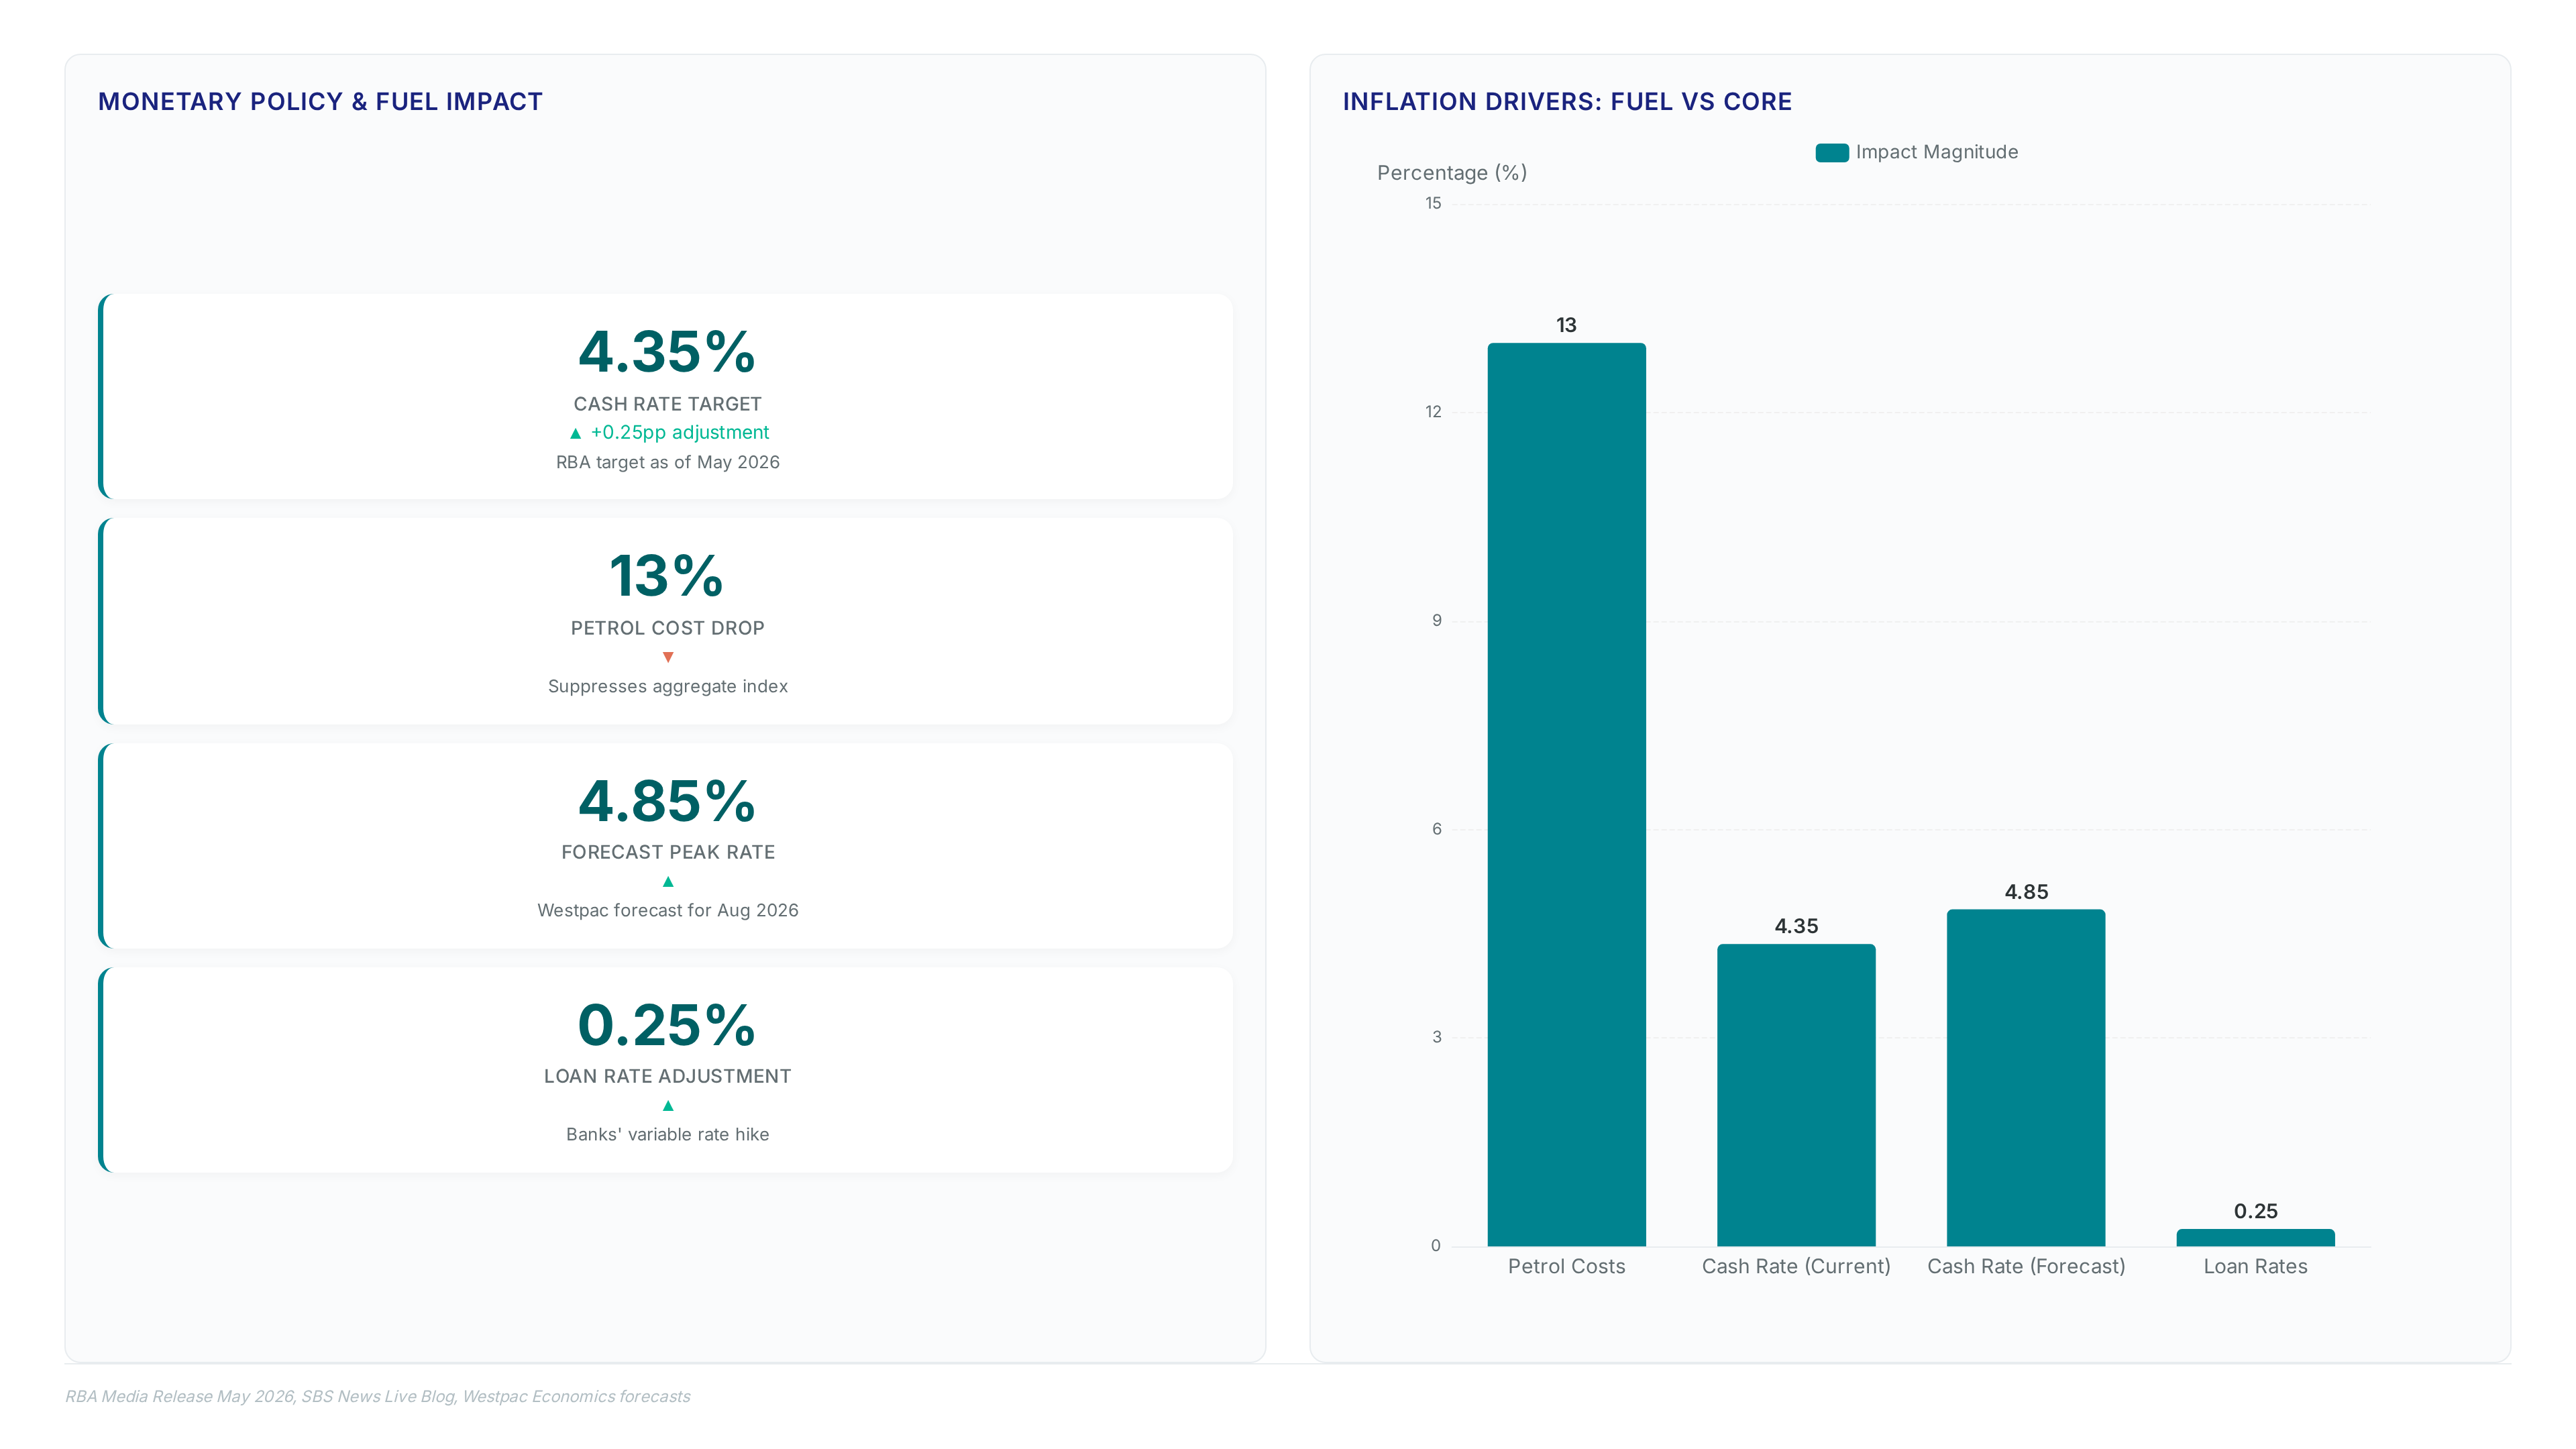
Automotive fuel declines drive the headline number lower while underlying measures remain elevated. The calculation mechanism removes extreme price movements, meaning a 13% drop in petrol costs suppresses the aggregate index without altering the trimmed mean trajectory. This divergence forces analysts to treat the headline print as a temporary distortion rather than a structural shift in purchasing power.
| Metric Component | Reaction to Fuel Drop | Policy Signal Value |
|---|---|---|
| Headline CPI | Decreases sharply | Low (noise-dominated) |
| Trimmed Mean | Unchanged by fuel | High (trend-accurate) |
| Cash Rate | Sensitive to core | Determines borrowing costs |
Market participants track the cash rate because the central bank prioritizes persistent inflation over transient energy shocks. Any upside surprise in the core data triggers immediate repricing in Australian rate futures, as the AUD reacts to the likelihood of sustained tightening. Headline relief masks the severity of underlying pressure, potentially delaying necessary fiscal adjustments. Falling pump prices provide no shelter if market services continue to accelerate above target bands.
Second-Round Pass-Through from Input Costs to Consumer Prices
Second-round pass-through occurs when firms with elevated purchase costs adjust selling prices. The RBA monitors this via trimmed mean signals rather than volatile energy dips. Some businesses are already transmitting these input shocks while others signal imminent action, creating asymmetric upside risk for core inflation. This mechanism operates independently of fuel drag because the calculation excludes specific volatile components.
The transmission lag creates a policy tension where headline relief masks persistent domestic pressure. Unlike transient fuel drops, service sector increases reflect embedded cost structures that resist rapid reversal.
| Cost Component | Pass-Through Speed | Inflation Impact |
|---|---|---|
| Imported Goods | Immediate | High volatility |
| Domestic Services | Lagged (3-6 months) | Persistent stickiness |
| Regulated Utilities | Delayed (policy-dependent) | Moderate baseline |
Operators must distinguish between temporary supply shocks and permanent structure shifts in the CPI basket. A failure to identify broadening pass-through risks underestimating the terminal rate required to return inflation to target. The divergence between falling energy costs and rising service prices confirms that underlying momentum remains unanchored from headline noise.
Upside Risks of Accelerated Cost Pass-Through
Accelerated cost pass-through occurs when businesses immediately translate elevated purchase costs into consumer prices, bypassing the absorption phase that typically dampens second-round effects. This mechanism drives the trimmed mean higher even as volatile energy components drag the headline figure downward.
Firms facing sustained input pressure adjust selling prices quicker than historical averages. Consumer spending patterns shift in response to these immediate price hikes. Inflation expectations become unanchored from the central bank's target band. Such an outcome would exceed the upper bound of substantial bank projections and signal persistent domestic inflationary pressure.
New dwelling costs face upside risk from data centre construction competing for skilled labour and materials. Both CBA and Westpac flag these construction pipeline pressures as a primary driver for persistent housing inflation. The mechanism operates through direct resource contention; large-scale infrastructure projects like the Microsoft Foundry deployments absorb specialized electrical and cooling talent pools before residential builders can secure contracts.
| Risk Factor | Primary Driver | Inflation Impact |
|---|---|---|
| Labor Scarcity | Data centre build-out | Sustained wage growth |
| Material Costs | Supply chain bottlenecks | Elevated input prices |
| Project Delays | Permitting complexity | Extended cost exposure |
Financial institutions backing these massive builds, including participants in the recent ANZ, face unique constraints. Unlike general manufacturing, specialized construction cannot easily import labor to meet sudden demand spikes. The limitation is geographic concentration; Sydney and Melbourne absorb the bulk of this labor competition, creating regional inflation hotspots that national averages mask. Residential project timelines will extend as material competition intensifies, locking in higher costs for longer durations. This ensures underlying inflation remains sticky even if headline fuel prices decline.
This metric isolates persistent price pressures that volatile fuel costs often mask, serving as the primary trigger for policy adjustments. Should the print exceed expectations, it confirms that selling price expectations remain unanchored despite energy relief. The cost of ignoring such a signal is a loss of credibility in the inflation targeting framework.
| Dimension | Headline CPI Signal | Trimmed Mean Signal |
|---|---|---|
| Primary Driver | Automotive fuel prices | Services and housing costs |
| Policy Reaction | No change (transient) | Hold or hike rates |
| Volatility | High (12-15% swings) | Low (sticky trend) |
Fuel declines create a false sense of disinflationary progress while core metrics harden. A divergence where headline falls but underlying inflation rises forces the central bank to prioritize the latter to prevent second-round effects. This complicates communication, as the public sees lower pump prices while the RBA holds borrowing costs high. Political friction arises from maintaining restrictive policy during falling headline inflation. However, failing to react to sticky core measures risks entrenching inflation expectations above the target band.
Applying May Trimmed Mean Forecasts to Rate Hike Scenarios
A May print exceeding the 3.6% consensus forces the RBA to prioritize core persistence over transient fuel declines. Westpac stands apart by forecasting two additional hikes in June and August, which would lift the cash rate to 4.85% if inflation validates their stance.
The structural tension lies in the lag between construction pressure and final dwelling prices, creating a window where underlying inflation appears contained before surging. Operators must watch for this delay, as waiting for headline confirmation often means reacting after the rate hike window has closed. Ignoring the trimmed mean signal in favor of headline relief risks anchoring inflation expectations above the target band permanently. The cost of premature easing exceeds the pain of sustained tightness when core measures accelerate.
Trimmed Mean vs Headline CPI Divergence in May
Headline inflation falls month-on-month as fuel prices drop, masking sticky core pressures that drive policy. The Reserve Bank of Australia prioritizes the trimmed mean because it filters volatile energy swings to reveal persistent price trends. A print exceeding this band signals that second-round effects from energy shocks are embedding in services and housing costs.
| Metric | Headline CPI Driver | Trimmed Mean Driver |
|---|---|---|
| Primary Force | Automotive fuel declines | Market services persistence |
| Direction | Downward pressure | Upward drift |
| Policy Signal | Transitory relief | Structural inflation risk |
Selling price expectations remain above long-run averages despite headline softness. The divergence creates a communication trap where falling pump prices falsely suggest broad disinflation while underlying costs accelerate. If the trimmed mean rises, the RBA cannot ease policy without risking an inflation spiral in the services sector. This tension forces a choice between acknowledging temporary fuel relief or combating entrenched core inflation. Data suggests the latter dominates the decision matrix for upcoming meetings.
About
Sofia Mendes, Broker Reviews & Trading Education Editor at ForexCFD, brings a distinct risk-management perspective to the analysis of Australia's trimmed mean inflation. While her daily work focuses on vetting regulated brokers and educating traders on execution quality, this expertise is vital when interpreting RBA policy signals that drive extreme volatility in AUD pairs. As the RBA closely monitors trimmed mean data to gauge sticky underlying inflation, any deviation from the forecasted 3.5%–3.6% range can trigger sharp market moves. Mendes connects these macroeconomic shifts to practical trading realities, explaining how rate hike probabilities impact spreads and margin requirements for retail participants. Her analysis bridges the gap between high-level central bank decisions and the tangible risks faced by traders navigating FX markets. By grounding complex inflation metrics in real-world trading consequences, she ensures the audience understands not just the data, but its direct impact on capital preservation and strategy.
Conclusion
When underlying price pressures persist despite temporary fuel relief, the operational breaking point arrives in the services sector where wage-price feedback loops solidify. The divergence between volatile energy costs and sticky core metrics means that static interest rates effectively become an accommodative stance if real rates fail to track rising inflation expectations. Operators relying on headline dips to forecast immediate easing will face a liquidity crunch as the window for refinancing narrows through late 2026.
Lock in fixed-rate debt facilities immediately if your variable exposure exceeds 15% of total liabilities, as the cost of capital will remain elevated well beyond current market pricing. Do not wait for the next quarterly report to validate this shift; the lag in construction pricing and service costs guarantees that official confirmation will arrive only after financing conditions tighten further. Audit your debt maturity schedule this week to identify refinancing cliffs occurring before June 2027, then engage lenders to extend terms while covenant thresholds remain manageable.
Frequently Asked Questions
Falling fuel prices drag down the headline figure significantly. However, trimmed mean inflation is projected to peak near 3.7% as underlying services pressure persists despite temporary energy relief masking core trends.
New dwelling costs are rising sharply due to labor competition. CBA forecasts these costs will increase 0.9% monthly, pushing annual new dwelling inflation to 5.6%, its fastest rate since July 2023.
Major banks expect annual trimmed mean inflation to edge higher. NAB and CBA forecast 3.5%, while Westpac projects a slightly higher 3.6%, reflecting concerns over construction pipeline pressures and data centre build-outs.
The cash rate remains static at 4.35% to combat sticky prices. This trajectory keeps real interest rates effectively lower than intended if underlying inflation peaks near 3.7% in mid-2026.
Automotive fuel prices fell approximately 13% over the month, subtracting meaningfully from the headline outcome. This sharp decline creates a divergence where headline numbers soften while core metrics remain elevated.