Core PCE Data: Fed Hawkishness Meets Oil Shock
Oil rebounded above $86 as US strikes on Iran reignited geopolitical risk while the Fed held rates steady.
Market volatility currently stems from the collision between hawkish Fed policy and escalating Middle East conflict, creating a precarious environment for risk assets. The Federal Reserve maintained its stance with Kevin Warsh warning that policymakers will tighten further if inflation persists, keeping pressure on liquidity. Simultaneously, renewed military operations targeting Tehran-aligned groups have disrupted supply expectations, forcing traders to weigh safe-haven demand against elevated interest rates.
This article analyzes how Core PCE inflation data interacts with these geopolitical shocks to drive price action. Readers will learn to interpret the impact of Federal Reserve rhetoric on currency pairs, assess the correlation between oil spikes and Gold stability near $4,000, and identify strategic entry points using economic calendars. We examine why diplomatic failures now outweigh technical indicators in the short-term.
Traders must navigate this environment by monitoring specific technical levels rather than relying on stale diplomatic optimism. The coming sessions will test whether inflation data can overshadow the immediate threat of expanded conflict in the region.
The Role of Core PCE and Fed Policy in Current Market Volatility
Core PCE as the Fed's Preferred Inflation Gauge
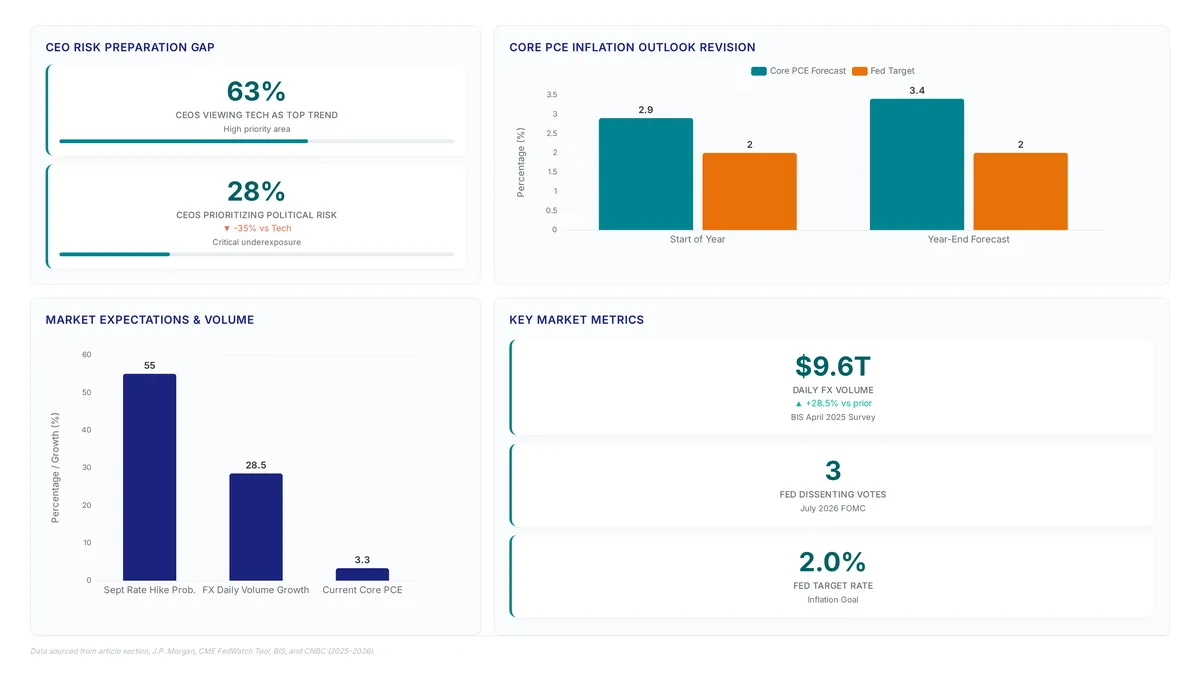
Recent readings show the metric holding at 3.3%, remaining well above the central bank's 2% target. This persistence drives the hawkish policy stance articulated by Chair Kevin Warsh, who signaled an unwillingness to tolerate entrenched price pressures. Supply shocks have complicated the disinflationary path, prompting J.P. Morgan to revise its yearend core PCE outlook upward to 3.4% from an initial 2.9% forecast. Market participants now track inflation expectations closely, as the divergence between realized data and previous models alters rate probability. The catalyst here is the structural shift in supply chains, creating a bias toward tighter monetary conditions for longer. Unlike the Consumer Price Index, Core PCE accounts for substitution effects, offering a smoother but often lagging view of consumer behavior. Data indicates this smoothness can mask rapid underlying accelerations until they become entrenched. Consequently, markets remain highly sensitive to incoming data as investors weigh geopolitical uncertainty against monetary policy expectations.
Translating Hawkish Fed Signals into Market Probability
Market participants currently price a 55% probability that the Federal Reserve will raise interest rates by 25 basis points in September 2026. This specific numerical assessment, derived from the CME FedWatch Tool, quantifies the abstract hawkish stance into actionable risk parameters for currency traders. The narrative driving this probability differs fundamentally from standard demand-pull inflation; instead, supply shocks in oil, gas, fertilizer, and helium create a divergence between economic reality and earlier expectations. These structural constraints force central bankers to prioritize price stability over growth, even as geopolitical tensions escalate. Forex markets react to this probability matrix through yield differentials, whereas commodities often respond to the physical scarcity underpinning the inflation data. Gold illustrates this tension, holding near $4,000 as inflation concerns reinforce a higher-rate outlook despite safe-haven demand. The supply shocks effectively trap asset prices between two opposing forces: the need for hedging against instability and the mathematical pressure of rising discount rates on non-yielding assets. Traders monitor these probability shifts to adjust use and exposure before consensus narratives fully penetrate price action.
Geopolitical Shocks Undermining Disinflation Progress
Oil prices rebounding above $86 create an immediate supplyside inflation risk that complicates Federal Reserve policy. The catalyst is the renewal of US strikes on Iran, which threatens crude supply chains and forces a reassessment of disinflation progress. Federal Reserve Governor Kevin Warsh signaled the central bank will not hesitate to tighten policy if inflation remains elevated, a stance that sharpens the divergence between US and Eurozone inflation trajectories. The Bank of England faces sticky core prices while the Fed confronts a distinct geopolitical premium embedded in energy costs. This environment creates a binary reaction in asset classes, distinguishing forex vs commodities reaction to fed policy.
Geopolitical Drivers Impacting Oil Prices and Safe-Haven Assets
Transmission Mechanism: US-Iran Strikes to Oil and Gold Valuations
Physical disruption risks in the Strait of Hormuz mechanically link geopolitical strikes to immediate risk-off capital flows. As the United States renewed strikes against Iran, the fragile ceasefire collapsed, forcing algorithms to price in supply chain constraints without delay. This escalation creates a direct feedback loop where energy prices spike on perceived blockade threats, establishing a hard floor for crude valuations. The transmission operates through a set causal chain:
- Military action threatens shipping corridors, raising insurance costs for maritime transit.
- Supply anxiety pushes WTI crude toward the $100 per barrel threshold if limitations persist.
- Investors rotate capital into safe-haven assets, sustaining gold demand.
| Driver | Mechanical Impact | Asset Response |
|---|---|---|
| Shipping Blockade | Increased Transit Risk | Oil Price Spike |
| War Escalation | Risk-Off Sentiment | Gold Bid |
| Yield Pressure | Opportunity Cost Rise | Capped Upside |
However, the rally in precious metals faces a structural headwind. Gold remains caught in a tug-of-war; while conflict drives demand, rising Treasury yields increase the opportunity cost of holding the non-yielding asset, creating a ceiling on price expansion. This tension means gold may remain resilient but range-bound despite the conflict.
Real-Time Asset Reaction: USD Strength Versus EURUSD and AUDUSD Weakness
EURUSD holds above the 1.1400 psychological floor while hawkish Fed rhetoric fuels dollar demand. The primary driver for this strength is the divergence in central bank messaging, where geopolitical sentiment outweighs local Eurozone improvements. Conversely, AUDUSD faces headwinds after annual inflation accelerated to 3.8%, creating policy uncertainty that suppresses the currency. Traders adjust positions during geopolitical risk by prioritizing liquidity over yield. The mechanism involves a rapid rotation into safe havens as military escalations threaten shipping corridors.
| Pair | Driver | Technical Bias |
|---|---|---|
| EURUSD | Fed Hawkishness | Neutral-Bullish |
| AUDUSD | Inflation Shock | Bearish |
| USDJPY | Rate Differential | Bullish |
However, the cost of holding short AUD positions rises if commodity prices spike unexpectedly. This tension forces operators to widen stop-losses beyond standard volatility bands. Until then, the market remains bifurcated between energy-driven inflation and monetary tightening. *Trading involves significant risk.*
Inflationary Feedback Loops: Core PCE Risks from Persistent Geopolitical Uncertainty
This flexible elevates stagflation risk as the primary narrative, challenging the Federal Reserve's dual mandate while keeping activity slow. The conflict supports the US Dollar and maintains Gold durability, yet higher yields ultimately cap safe-haven gains. Conversely, persistent tension ensures inflation remains sticky, strong the central bank to maintain restrictive policy longer than anticipated. The cost of this feedback loop is measurable: if inflation stays elevated, markets will punish duration assets aggressively. Unlike transient supply glitches, war-driven inflation resists standard monetary tightening, creating a policy dilemma where stopping price growth requires crushing demand. Markets remain highly sensitive to whether diplomatic channels can stabilize the region, as any verified reduction in tension would likely lower energy costs and allow disinflation to resume. The conflict is influencing asset classes by supporting the US Dollar and keeping Gold resilient, while increasing equity market volatility. Until then, volatility remains the only constant.
Strategic Entry Points Using Economic Calendars and Technical Levels
Defining High-Impact Economic Calendar Events for USDJPY

The US Core PCE Price Index serves as the Federal Reserve's preferred inflation measure, commanding a 'Very High impact' rating that dictates immediate liquidity flows. Stronger-than-expected data strengthens the US Dollar and pushes Treasury yields higher, creating a mechanical headwind for gold despite its safe-haven status. Conversely, weaker figures would support risk assets and weaken the greenback, invalidating bullish USDJPY setups near current resistance.
| Scenario | USD Reaction | Treasury Yields | Risk Asset Impact |
|---|---|---|---|
| Beat | Strengthen | Rise | Pressure |
| Miss | Weaken | Fall | Support |
Traders asking if they should buy gold before PCE data must recognize that rising opportunity costs from sustained high yields often suppress precious metals during hawkish cycles. ForexCFD.top traders should prioritize the technical break of key levels over speculative pre-event positioning. A decisive close below the 163.00 support on USDJPY would flip the bias to neutral, signaling that geopolitical premiums are fading quicker than inflation expectations.
Executing Entries Using USDJPY Support at 163.00 and Resistance at 164.50
The catalyst is Friday's Bank of Japan Outlook Report, creating a bullish bias that demands precise execution around the 163.00 floor. Traders should enter long positions on a rejection wick at the 163.00 support level, targeting the 164.50 resistance zone where supply historically congregates. This approach aligns technical structure with the fundamental expectation that geopolitical tension will sustain dollar strength against the yen. However, the Japanese Ministry of Finance previously intervened to support the Yen following similar escalations, introducing a sharp retracement risk that invalidates aggressive breakout entries.
| Trigger Condition | Action | Invalidates If |
|---|---|---|
| Price touches 163.00 | Buy Limit | Close below 162.80 |
| Break above 164.50 | Buy Stop | Close below 164.20 |
Meanwhile, the hidden cost of this strategy is the liquidity vacuum during the Asian session, which often exaggerates moves before the London open. ForexCFD.top provides the necessary low-latency infrastructure to navigate these specific volatility windows without slippage. A daily close below 163.00 flips the bias to neutral, requiring immediate exit to preserve capital. Conversely, a sustained break above 164.50 targets new highs driven by widening yield differentials. Investors must watch for any unexpected shift in the Fed's hawkish rhetoric, as a dov pivot would dismantle the dollar's safe-haven premium instantly.
Managing Volatility Risks During German Preliminary GDP and Core PCE Releases
Thursday's convergence of German Preliminary GDP and US Core PCE data creates a high-friction environment where liquidity thins rapidly. This flexible increases Forex volatility significantly, often triggering stop-losses on premature entries before the true trend direction establishes.
| Event | Expected Impact | Asset Reaction |
|---|---|---|
| German Preliminary GDP | Medium | EURUSD fluctuation |
| US Core PCE | Very High | USD strength |
| Eurozone CPI Flash | High | Broad EUR move |
Traders must avoid executing positions when multiple High impact events cluster, as seen with the upcoming Eurozone CPI Flash Estimate. The cost of trading through this noise is measurable; J.P. At ForexCFD.top, we advise widening stops or reducing position size until the data releases clear the path. However, false breakouts frequently occur if traders ignore the interplay between stagflation risk and central bank rhetoric. A sudden dovish pivot from the Bank of England, where rates sit at 3.75%, would invalidate the bullish USD thesis immediately. Monitor the reaction at support levels closely; a failure to hold suggests further downside for equities.
Risk Management Protocols for Uncertain Market Conditions
Defining Overexposure Amid Geopolitical Shocks and PCE Volatility
The specific danger lies in holding used positions that assume normal distribution while the market prices in a hawkish Federal Reserve stance against supply shocks. Hidden costs of this definition include:
- Margin calls triggered by widening spreads rather than price direction. * Slippage exceeding stop-loss buffers during headline spikes. * Correlation breakdown where hedges like Gold and the Dollar rise together.
Most traders mistake high volatility for opportunity, yet portfolio decay accelerates during significant drawdowns without immediate de-using. The limitation of standard risk management is its reliance on historical variance, which cannot price in real-time diplomatic fractures or unexpected central bank pivots. Consequently, a portfolio is overexposed not merely by size, but by its inability to absorb simultaneous shocks from Middle East escalation and sticky inflation prints.
Protocol for Fixing Overexposure During US-Iran Strike Escalation
The risk-to-reward ratio deteriorates rapidly during these events because correlation matrices break down, causing distinct asset classes to move in unison against the trader. Hidden costs of delayed action include:
- Slippage exceeding normal spread parameters during liquidity crunches. * Margin calls triggered by sudden volatility expansion in safe-haven pairs like USDJPY. * Psychological paralysis preventing execution at deteriorating price levels.
A potential 60-day maritime traffic agreement could alleviate some pressure, yet the binary nature of diplomatic solutions means traders cannot rely on de-escalation for risk management. The limitation of this protocol is that it locks in losses to preserve capital, a painful but necessary trade-off when geopolitical premiums inflate asset prices beyond fundamental value. A hawkish Fed message from officials like Kevin Warsh could further temper risk-on sentiment, compounding the downside for overexposed positions.
Failure Modes in Risk Parameters When Core PCE Exceeds Forecasts
This mechanical breakdown occurs because standard volatility bands assume normal distribution, yet a hawkish Federal Reserve response to inflation data compresses liquidity across correlated assets simultaneously. Kevin Warsh recently stated the central bank would not hesitate to tighten policy, a stance that invalidates static hedging models during surprise prints. The strategic gap in risk preparation is evident; while 63% of CEOs view technology as a top trend, only 28% prioritize political risk management, leaving portfolios exposed to dual shocks from inflation and geopolitical forces.
| Risk Parameter | Failure Mode | Consequence |
|---|---|---|
| Fixed Stop-Loss | Slippage during spike | Loss exceeds max drawdown |
| Correlation Hedge | Breakdown of inverses | Double exposure loss |
| Use Ratio | Margin call trigger | Forced liquidation |
Hidden costs of delayed parameter adjustment include:
- Execution at prices far beyond technical support levels. * Amplified losses due to stagflation risk impacting both growth and inflation hedges. * Inability to re-enter positions after the initial volatility spike subsides.
The data sets the bias; the chart sets the entry. Analytical frameworks are necessary to navigate these complex conditions without relying on external, unverified tools.
About
Marcus Halloran, Chief Market Strategist at ForexCFD.top, leads our macro analysis with a focus on G10 currencies and central bank policy. His background as a former interbank FX strategist in London provides the precise expertise required to dissect complex inflation metrics like Core PCE. In daily practice, Halloran translates Federal Reserve signals and interest rate differentials into actionable frameworks for retail traders, directly connecting high-level monetary policy to volatile moves in USD pairs and gold.
As the US renews strikes on Iran and the Fed maintains a hawkish stance, understanding the interplay between geopolitical risk and inflation data is critical. Halloran's work at ForexCFD.top centers on decoding these exact catalysts for our global audience. By using his experience in reading dot plots and economic calendars, he ensures our coverage cuts through the noise of market uncertainty. This article reflects his rigorous approach to scenario mapping, offering readers clear, data-led insights into how Core PCE figures may dictate the next substantial shift in forex and commodity markets.
Conclusion
When core PCE inflation persists above forecasts, static risk models fail because they cannot account for the simultaneous liquidity compression across correlated assets. The ongoing operational cost of this blindness is execution at prices far beyond technical support, turning manageable drawdowns into forced liquidations. Traders must recognize that a geopolitical environment set by government intervention requires flexible parameters rather than fixed stop-losses. Relying on standard volatility bands during these periods invites slippage that exceeds maximum drawdown limits.
ForexCFD.top recommends that traders immediately replace fixed stop-loss orders with flexible, volatility-adjusted parameters before the next data release. This shift is critical because the current environment renders traditional correlation hedges ineffective when the Federal Reserve signals aggressive tightening. Do not wait for a maritime agreement or diplomatic de-escalation to validate your exposure; these binary events offer unreliable risk management foundations.
Start by auditing your current position sizing against a scenario where oil prices spike toward $100 per barrel this week. Adjust your use ratios now to withstand the margin calls that arise when inflation hedges and growth assets decline together. The priority is preserving capital through mechanical discipline, not predicting diplomatic outcomes.
Frequently Asked Questions
The metric holding at 3.3% sustains tight policy. This figure remains well above the central bank's 2% target, forcing traders to expect higher rates for longer.
J.P. Morgan raised its outlook to 3.4% from 2.9%. This upward revision reflects supply shocks that complicate the disinflationary path and alter rate probability models.
Markets price a 55% chance of a September increase. This specific probability quantifies hawkish Fed signals into actionable risk parameters for currency traders today.
Prices rebounding above $86 create immediate inflation risks. This energy cost surge threatens crude supply chains and forces a reassessment of disinflation progress globally.
Gold holds near $4,000 as inflation concerns reinforce higher rates. This tension traps asset prices between safe-haven demand and the pressure of rising discount rates.
References