GBP/USD Stuck: Inflation Data and 1.3400 Support
GBP/USD sits stuck between 1.3400 and 1.3450. FXStreet notes the market is waiting on UK inflation data and Fed projections before making a move.
Cable valuation currently hinges on central bank divergence, not technical momentum. The Federal Reserve target range sits at 3.50% - 3.75% as of mid-June 2026. Traders face a messy environment where rate hike expectations clash with retreating oil prices. The gap between the 50-day EMA and 200-day EMA defines this consolidation zone. We need to look at strategic execution around high-impact data, specifically navigating volatility surrounding the Bank of England decision and the critical 1.3400 support level.
The Role of Central Bank Divergence in GBP/USD Valuation
Defining Core CPI and the Fed Dot Plot Mechanics
Headline inflation counts every price change. Core CPI strips out volatile energy and food costs to expose persistent pressure beneath. Central banks ignore transient fuel spikes when calibrating policy, focusing instead on this sticky component. The Bank of England explicitly targets price stability, set as a steady inflation rate of around 2%, making the core reading the primary trigger for rate adjustments. Dating back to 886 AD, the Pound Sterling now operates within this rigid modern framework of inflation targeting.
The Federal Reserve signals its longer-term trajectory through the dot plot, a chart displaying individual committee members' rate projections. These dots provide a forward-looking signal regarding whether the Fed intends to maintain its current range or pivot. The median dot offers a snapshot of the committee's collective outlook on future rates. Trouble starts when the driver of inflation retreats before policy tightens. Recent oil price declines following geopolitical de-escalation suggest headline numbers may fall even as the dot plot remains hawkish. This divergence forces operators to choose between trading the lagging policy signal or the leading commodity data.
Applying Rate Expectations to GBP/USD Valuation Shifts
Rate expectations now price hikes into late 2026 rather than cuts, a direct reversal driven by the Iran War. This shift forces traders to re-evaluate GBP/USD valuation models that previously assumed monetary easing. Market participants aggressively price in tighter policy for both the Fed and the Bank of England due to persistent inflation fears while the Federal Reserve maintains its target range. Current high yields compete with future tightening forecasts in a complex environment. Data indicates the cost of holding USD positions remains elevated, yet monetary easing expectations later in the year introduce temporal volatility. A tangible example occurred when the EUR/USD pair appreciated 0.53% in a single week, proving sentiment can drive price action rapidly absent fundamental data releases.
Risks of Hawkish Stance Amid Retreating Energy Costs
Maintaining a hawkish posture while the inflation driver retreats constitutes the primary risk. Crude Oil prices have slid this week following a US-Iran peace deal, creating a scenario where policy tightens against a fading shock. The GBP/USD pair slipped below the 1.3250 price level after failing to break through the 23.6% Fibonacci retracement level, signaling technical vulnerability amid fundamental contradiction. Interpreting dot plot changes requires distinguishing between transient energy spikes and persistent core pressure, yet the current market pricing ignores the rapid decay in fuel costs. Traders must recognize that leaning toward hikes into late 2026 for both the Fed and the Bank of England may be premature if oil stability persists. Fed hawkishness drives the dollar higher, but these gains may fade if the energy slump continues. This creates a specific operational hazard where the inflation narrative may decouple from reality as commodity markets stabilize. Operators should watch for a divergence where rate markets price pain that commodity markets no longer support.
Technical Mechanics of Moving Averages and Momentum Indicators
Exponential Weighting in 50-Day and 200-Day EMAs
Cable trades inside a tight corridor set by the 50-day Exponential Moving Average (EMA) at 1.3450 and the 200-day EMA near 1.3400. Unlike simple averages that treat all days equally, the EMA applies a multiplier to recent prices, making the indicator react quicker to new information while smoothing out old noise. This mathematical weighting creates flexible barriers where momentum often stalls.
The current market structure shows price failing to clear the upper average before retreating. Repeated rejections near these technical resistance zones reinforce a bearish bias until a decisive break occurs. Traders watch the Stochastic RSI for confirmation, as this oscillator measures the speed of price changes relative to its own range. When the Stoch RSI sits mid-range, it signals a lack of conviction, mirroring the indecision seen between the two moving averages.
| Feature | 50-Day EMA | 200-Day EMA |
|---|---|---|
| Sensitivity | High (Recent) | Low (Historical) |
| Current Role | Immediate Resistance | Substantial Support Floor |
| Price Action | Rejection point at 1.3450 | Recovery zone at 1.3400 |
The limitation of this setup is its susceptibility to whipsaws during low-volume sessions. A false break below the 200-day EMA could trigger algorithmic selling before a rapid recovery. Conversely, clearing the 50-day EMA requires sustained buying pressure to invalidate the broader downtrend. Market participants must wait for a close beyond these weighted averages rather than reacting to intraday spikes.
Interpreting Stoch RSI Mid-Range Signals for Cable
Mid-range Stoch RSI readings on the daily chart signal a market devoid of directional conviction. This oscillator configuration requires traders to wait for a decisive break before committing capital to Cable. The current positioning between the 50-day EMA and 200-day EMA confirms that momentum is currently neutralized by competing fundamental forces.
- Monitor the Stochastic RSI for an exit from the 40 to 60 valuations zone.
- Validate any move with volume exceeding the recent fifty-pip average range.
- Align entries with the broader bearish bias observed after repeated resistance failures.
The bias remains higher only while price action sustains above 1.3400. A clean break above 1.3450 serves as the primary trigger for long entries, targeting the 1.3450 resistance extension.
Price briefly breaches the 200-day EMA floor only to reverse, trapping breakout traders in low-volume ranges. During Tuesday's session, the pair dipped just under 1.3400 before recovering, resulting in a range of barely fifty pips. This specific failure mode occurs when algorithms hunt liquidity below Resistance without sustaining momentum against the 50-day EMA.
| Scenario | Price Action | Consequence |
|---|---|---|
| Bull Trap | Break above 1.3450 then fail | Longs trapped at top |
| Bear Trap | Break below 1.3400 then recover | Shorts squeezed early |
| Valid Break | Close beyond average + volume | Trend continuation |
The cost of a failed technical breakout defines vulnerability to further slides, representing a tangible loss threshold for long positions. A sustained move beyond these levels is required to ease the broader bearish bias observed in recent sessions. Losing the 1.3400 support level could lead to 1.3350, invalidating the higher bias while 1.3400 holds.
- Wait for a daily close outside the EMA corridor.
- Confirm volume exceeds the recent fifty-pip average range.
- Avoid entries based solely on intraday wicks.
Traders must distinguish between noise and genuine displacement to avoid becoming liquidity for larger institutions. The market rewards patience when conviction is absent, particularly ahead of high-impact data releases.
Strategic Execution for Trading Around High-Impact Data
Defining the 48-Hour GBP/USD Event Window
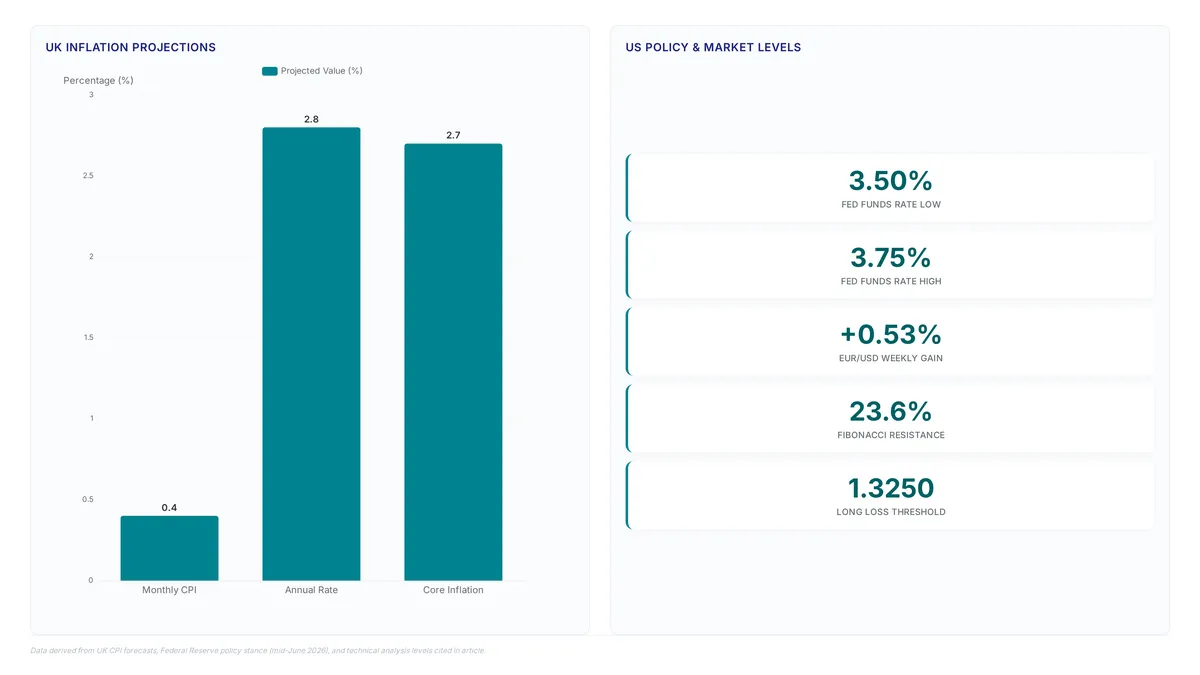
Market attention fixes on the UK Consumer Price Index (CPI) at 06:00 GMT, where monthly figures are expected to cool to 0.4%. This initial print sets the tone before the market shifts focus to the Federal Reserve decision scheduled for 18:00 GMT, with a policy hold considered all but locked. Volatility clusters around these central bank decision dates, establishing a pattern of event-driven movements rather than steady drifts.
Traders must synthesize the annual inflation rate, projected to climb from April's 2.8%, against the backdrop of steady core inflation near 2.7%. The divergence between these domestic prints and the anchored US policy stance creates a narrow window for directional conviction. Visualizing the density of high-impact events aids liquidity management and risk hedging decisions. The market waits for the Fed chair's tone to confirm if the dot plot aligns with current hike pricing. Annual inflation is projected to climb, yet core figures remain steady, creating a divergence that often traps early positioners in false breakouts. Technical analysis highlights repeated failures near specific resistance barriers, requiring a sustained move beyond these levels to ease the broader bearish bias. A failed technical breakout defines vulnerability to further slides below 1.3250, representing a tangible loss threshold for long positions.
MUFG analysts warn that late-entry long USD positions carry a temporal cost if energy prices continue their recent slump, implying that chasing the dollar post-print is risky without sustained volume. Spreads widen notably during the release window as volatility clusters tightly around these decision times. A hawkish shift from Chair Warsh could strengthen the dollar regardless of British inflation figures, invalidating a long GBP thesis based solely on CPI. Traders face potential opportunity costs by not fixing USD payment rates before the July 29, 2026 Fed decision. Gold remains a story about real yields, fear, and the dollar - in that order. Used metals trading involves significant risk of loss.
Exit Strategy Checklist for Fed Chair Warsh Press Conference
The current curve prices a hike, creating a dangerous mismatch with previous projections that implied a cut. This discrepancy forces rapid liquidation if the Chair does not explicitly validate the aggressive pricing.
Validate your exit against these six triggers during the 18:30 GMT session:
- Tone shifts to prioritizing inflation over growth concerns.
- Projections contradict the market expectation of a cut this year.
- Volatility clustering intensifies around the central bank decision window.
| Condition | Action |
|---|---|
| Hawkish Tone | Exit Longs |
| Dovish Tone | Hold Positions |
| Break below Support | Trigger Stop Loss |
| Clear Above Resistance | Scale Out Partially |
- Monitor the dot plot updates closely for any shift in the median forecast.
- Watch for widened spreads implied during the June 16, 17 FOMC window.
Traders often overlook that volatility clustering around Fed events creates false breakouts before the true trend emerges. The GBP/USD pair must clear technical barriers to avoid sliding back into its monthly range. A failure to address the inflation trajectory clearly will likely result in a sharp reversal. Used metals and currency pairs carry significant risk; market participants should be aware that widened spreads are implied during the June 16, 17 FOMC window. The cost of holding through ambiguous commentary often exceeds the potential gain from a delayed move.
Risk Assessment of Range-Bound Markets Amidst Policy Shifts
Defining False Breakout Mechanics in GBP/USD Range-Bound Markets
Price stalling near the 1.3450 resistance before fading defines the immediate trap for breakout traders. During Tuesday's session, the pair dipped just under 1.3400 before recovering, resulting in a range of barely fifty pips that punishes premature positioning. This behavior creates a false signal where momentum appears to build only to reverse at the 50-day EMA. The cost of such a failed technical breakout is vulnerability to further slides below 1.3250, representing a tangible loss threshold for long positions. Hidden costs in this environment include:
- Slippage during low-liquidity reversals.
- Widening spreads ahead of the Federal Reserve (Fed) decision.
- Opportunity cost from capital tied in stagnant trades.
- Increased margin requirements during volatility spikes.
A hot UK inflation print offers fuel, yet the divergence between central bank policies complicates the trend. Breaks above 1.3450 without sustained volume often invalidate quickly, trapping bulls who ignore the overarching range-bound mechanics. Traders must wait for a confirmed close beyond these Support and Resistance Zones rather than reacting to intra-session wicks.
Applying 1.3400 Support and 1.3450 Resistance Triggers to Trade Execution
The 1.3400 floor acts as the definitive structural anchor, reinforced by the 200-day EMA and round number psychology. Traders must distinguish between a liquidity sweep wick and a confirmed close, as false breakouts frequently trap premature entries near the 1.3450 ceiling. When price action stalls at this upper Resistance tied to the 50-day EMA, the market often lacks the momentum to sustain a breakout without fresh fundamental fuel. This validates a bearish bias if the 1.3400 support fractures decisively. The primary risk in this range-bound environment is the divergence between static technical levels and shifting central bank expectations.
Hidden costs of trading these tight ranges include:
- Spread widening during data gaps.
- Slippage on stop-loss execution.
- Opportunity cost of capital tied in sideways movement.
- False signal generation from algorithmic noise.
- Elevated transaction fees during choppy conditions.
The Federal Reserve decision and UK inflation prints provide the necessary volatility to resolve this standoff. Until a daily candle closes outside the 1.3400-1.3450 corridor, the market remains in a no-trade zone for directional strategies. Patience yields improved risk-reward ratios than chasing wicks in low-liquidity windows.
Risks of Contradictory Oil Price Signals and Fed Dot Plot Shifts on Inflation Expectations
Retreating crude prices directly conflict with hawkish Fed projections, creating a volatile trap for breakout traders. When energy costs slide while central bank dots signal higher rates, the resulting divergence often generates false signals that invalidate standard range-bound strategies. A hot UK inflation print provides the cleanest fuel for upside, yet this momentum faces immediate headwinds if oil continues its decline. The market currently prices aggressive tightening, but analysts suggest these dollar gains may fade if the energy slump persists, imposing a temporal cost on late-entry long positions.
Traders face specific hidden costs when navigating this contradictory environment:
- Whipsaw execution near the 1.3400 support level.
- Misinterpreting transient oil moves as permanent inflation shifts.
- Over-leveraging based on dot plot projections that lag reality.
- Ignoring the decay in fuel costs while pricing in rate hikes.
About
Aisha Rahman, Gold & Commodities Analyst at ForexCFD.top, brings a unique macroeconomic perspective to GBP/USD analysis through her deep expertise in global capital flows. While her primary focus remains on XAUUSD and commodity markets, her daily work tracking Federal Reserve policy and real yields directly informs her understanding of dollar-driven pairs like Cable. The current market calm ahead of UK inflation data and the Fed decision requires the same rigorous assessment of central bank signals that defines her research. At ForexCFD.top, an independent publication serving retail traders globally, Aisha applies her structured approach to decode how shifting interest rate expectations impact both safe-haven assets and substantial forex pairs. Her background in the Gulf's financial sector ensures a disciplined, risk-aware interpretation of technical levels between the 50-day and 200-day EMAs. This cross-asset insight allows her to contextualize GBP/USD movements within the broader narrative of global liquidity and investor sentiment.
Conclusion
GBP/USD trading breaks down when technical resistance at 1.3450 clashes with diverging fundamental drivers like oil prices and core inflation. The ongoing operational cost here is capital erosion from whipsaw execution, where traders enter breakouts that lack the necessary energy sector backing to sustain momentum. As market expectations shift toward Federal Reserve easing throughout 2026, the current tight corridor between the 50-day and 200-day EMA becomes a temporary containment zone rather than a permanent equilibrium. Relying on headline data alone invites failure because policy lags mean restrictive stances may persist even as physical commodity prices fall.
You must prioritize core inflation trends over transient energy spikes before committing to directional positions. Do not assume a breakout above the 50-day EMA confirms a trend reversal without concurrent strength in broader macro drivers. The window for profiting from simple range-bound strategies closes as monetary policy diverges further from commodity cycles. Start by mapping your entry points strictly against the 200-day EMA support level this week, ignoring any price action that occurs without a corresponding shift in inflation expectations or oil stability. This disciplined approach isolates genuine trend initiation from noise generated by contradictory signals.
Frequently Asked Questions
The pair trades between the 50-day EMA at 1.3450 and the 200-day EMA near 1.3400. Traders should watch for a break above resistance or a drop below support to signal the next major directional move.
The Fed holds rates between 3.50% and 3.75%, creating high yields that compete with future tightening forecasts. This elevated cost of holding USD positions introduces temporal volatility while the market awaits clearer policy signals.
The pair slipped after failing to clear the 23.6% Fibonacci retracement level. This technical failure signals vulnerability when fundamental drivers like oil prices retreat despite hawkish central bank positioning.
The Bank targets a steady inflation rate of around 2%, making Core CPI the primary trigger for rate adjustments. Policymakers focus on this sticky component while ignoring transient fuel spikes to calibrate monetary policy effectively.
Sentiment can drive price action rapidly, as seen when EUR/USD appreciated 0.53% in one week. This demonstrates that market narratives often dictate moves absent fundamental data releases, requiring traders to monitor sentiment closely.
References