Rate forecast: PCE deflator drives Fed calls
The PCE deflator is accelerating, pushing year-over-year inflation back above 4% according to Wells Fargo Securities. Readers will learn how to interpret core inflation metrics, analyze the mechanics of real disposable income, and forecast central bank rate decisions in North America based on these diverging signals.
Wells Fargo Securities reports that while nominal personal spending rose at a solid pace in May, much of this gain reflects higher energy prices rather than broad volume increases. The firm notes that real disposable income has slipped into negative territory, with savings rates hovering near historic lows. This flexible suggests households are increasingly stretched even as second-quarter consumption tracks a modest pace. In Canada, inflation remains primarily energy-driven, creating a complex backdrop for monetary policy across the continent.
Understanding these mechanics is critical for navigating the current environment. The discussion will then dissect the relationship between soft income dynamics and consumer durability. Finally, we will apply this data to forecast Central Bank rate decisions, specifically looking at potential outcomes for Banxico and the Federal Reserve as they respond to sticky inflation and weakening purchasing power.
Defining Core Inflation Metrics and the PCE Deflator
PCE Deflator Definition and Core Inflation Mechanics
The PCE deflator tracks price movements across a flexible basket of goods, adjusting constantly as shoppers substitute cheaper alternatives for expensive ones. Static indices miss this behavioral shift, yet the flexible weighting provides a clearer picture of eroding purchasing power. Core inflation strips volatile food and energy components to reveal the persistent trends driving central bank policy. Recent data shows the headline index rose 0.4% monthly, while the year-over-year rate holds at 4.1%. However, this weighting methodology creates a lag in reflecting rapid consumer behavioral shifts during acute supply crises. Traders at ForexCFD.top monitor these divergences to anticipate volatility in USD pairs before official rate decisions. A sharp reversal in energy costs without corresponding core softening would invalidate the current hawkish bias.
Interpreting Headline vs Core PCE Data Signals
Nominal spending gains often mask weak real consumption volumes when energy costs drive the headline index. Gasoline prices act as the primary catalyst, creating a bias where top-line growth appears resilient despite eroding purchasing power. We expect personal spending to rise at a 0.6% clip, yet this reflects higher prices rather than a broad pickup in sales volumes. Divergence between headline and core inflation signals whether price pressure is temporary or embedded. Market participants track both metrics, noting the narrow gap suggests broader inflammatory pressure beyond isolated sector spikes inflation metrics. Larger average tax refunds recently offset fuel costs, a tailwind now fading as refund flows slow. Nominal strength can delay central bank easing even as fundamentals deteriorate. ForexCFD.top analysts separate these signals to avoid false breakouts in currency pairs tied to consumer health. A sustained drop in savings rates near historic lows would confirm the view that households are stretching income to sustain current spending levels.
| Metric Type | Primary Driver | Policy Implication |
|---|---|---|
| Headline PCE | Energy Prices | Temporary Spike |
| Core PCE | Service Costs | Rate Trajectory |
Real consumption volumes could contract sharply despite stable nominal output, forcing a reassessment of Q2 growth forecasts.
Risks of Energy-Driven PCE Distortion on Real Income
Headline acceleration driven by gasoline costs creates a false positive bias for consumption strength while eroding purchasing power. The primary risk lies in the composition of nominal gains, as most spending increases merely reflect higher prices rather than volume growth. Real disposable income sits firmly in negative territory. Savings rates hover near historic lows. Households stretch finances despite resilient top-line data. This divergence between nominal durability and real weakness complicates the interpretation of inflation metrics for traders.
| Metric Type | Driver | Implication for Real Income |
|---|---|---|
| Headline PCE | Energy prices | Distorts perception of demand strength |
| Core PCE | Broad services | Reveals underlying inflation persistence |
| Real Income | Wage vs. Price gap | Signals consumer fatigue risk |
ForexCFD.top analysts note that relying solely on headline figures invites mispricing of central bank reaction risks. Energy pass-through may lag, masking the immediate hit to discretionary budgets. Consequently, a strategy predicated on strong consumer spending faces reversal if volume data fails to confirm price-driven nominal gains. The view flips only if ex-energy volumes demonstrate sustained expansion independent of price effects. Until then, the bias remains defensive against sectors sensitive to real income compression. Traders must distinguish between price-driven nominal lifts and genuine demand expansion to avoid false signals.
Analyzing Real Disposable Income and Consumer Spending Mechanics
Real Disposable Income Mechanics Amid Gasoline Price Shocks
Real disposable income excluding transfer payments has slipped into negative territory on a year-ago basis, eroding purchasing power as rising fuel costs impact household budgets. Larger average tax refunds offset these higher gasoline prices in recent months, but that tailwind is fading as refund flows slow. Consumer inflation in Canada remains energy-driven, with little evidence of broader price pressure building thus far. Market participants monitor these real-income divergences to anticipate shifts in central bank policy. The next PCE release will confirm if energy shocks remain transitory or become embedded in core expectations.
Analyzing Nominal Spending Growth Versus Real Volume Trends
Distinguishing price-driven nominal increases from genuine volume expansion requires isolating the PCE deflator impact on aggregate data. Mechanical separation of these components reveals a sharp divergence for market participants. When the PCE deflator accelerates alongside flat real consumption, households sustain expenditure by drawing down savings rather than expanding purchasing power.
| Component | Driver | Volume Implication |
|---|---|---|
| Nominal Spending | Price inflation | Neutral to negative |
| Real Consumption | Sales quantity | Subdued growth |
| Income Base | Wage stagnation | Eroding support |
This flexible creates a fragile equilibrium where real disposable income constraints eventually force a contraction in discretionary categories. World Cup activities may offer transient offsets in hospitality sectors, yet the underlying trajectory remains constrained by eroding fundamentals. Analysts monitoring EUR/USD volatility note that the British Pound held gains above the 1.3150 level ahead of the release of critical US PCE inflation data, demonstrating immediate market sensitivity to US consumer fundamentals. The US Dollar has maintained an upward trajectory in June 2026, supported by what Commerzbank describes as a "steady" economy, countering narratives of immediate fundamental weakness. Nominal durability remains an illusion of inflation until real volumes recover.
Policy Risks of Energy-Driven Inflation Without Broad Pass-Through
Energy shocks create policy friction when central banks mistake transient fuel spikes for permanent demand inflation. The Bank of Canada signaled willingness to look through current energy-driven inflation absent clear evidence of broad-based pass-through to other consumer prices. Trimmed mean inflation is projected at 2.0%, suggesting underlying pressure remains contained despite headline volatility. Policymakers tightening prematurely based on headline figures alone risk stifling growth driven by fading tax refund tailwinds rather than strong organic demand.
| Region | Inflation Driver | Policy Risk |
|---|---|---|
| Canada | Energy costs | Premature tightening |
| United States | Broad pass-through | Lagged response |
Mechanical failure occurs when PCE deflator acceleration triggers hawkish pricing models that ignore real income contraction. Market participants monitoring the July 29, 2026, Fed decision face uncertainty regarding how the central bank will balance sticky inflation against potential signs of consumer weakening. Unlike the US, where core metrics align more closely with headline data, Canadian core measures show less divergence from targets. Specific risk lies in a synchronization error where energy volatility forces a rate path inconsistent with actual wage growth dynamics. If price pressures stay largely contained to energy and the U.S., Iran interim peace deal holds, oil prices should gradually decline as supply improves, giving the BoC greater scope to delay tightening.
Forecasting Central Bank Rate Decisions in North America
Defining Core Inflation Metrics for North American Policy
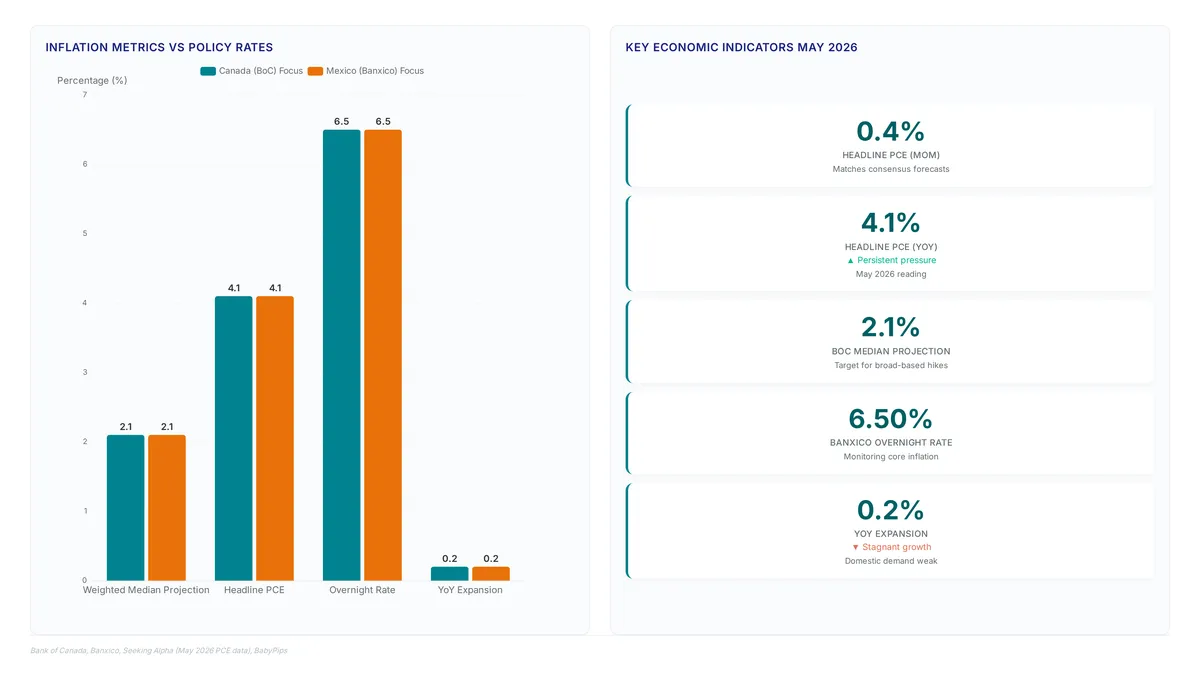
Policy divergence stems from how central banks filter volatile energy costs from underlying price trends. The Bank of Canada (BoC) distinguishes between headline figures and trimmed mean projections to gauge persistent inflationary pressure. While headline CPI may spike, the BoC focuses on the weighted median inflation projection of 2.1% to determine if price hikes are broad-based. This distinction allows policymakers to look through temporary energy shocks without triggering unnecessary tightening cycles. In Mexico, Banxico monitors core inflation to assess if its 6.50% overnight rate has sufficiently cooled domestic demand. Unlike headline metrics that fluctuate with oil prices, these core measures isolate the components that drive long-term wage and pricing behavior. Traders apply these specific core metrics rather than headline noise to position ahead of rate decisions. The primary risk remains that prolonged energy costs eventually bleed into core services, forcing a policy reaction even amidst weak growth.
Applying GDP Contraction Data to Banxico Rate Forecasts
Weak growth data confirms Banxico will hold rates steady rather than resume cutting immediately. Year-over-year expansion remains stagnant at 0.2%, indicating domestic demand has not recovered from previous tightening cycles. However, persistent inflation prevents policymakers from reacting to this output gap with rate cuts. The cost of capital divergence between Mexico and the US complicates this stance, as the Dollar maintains upward pressure on emerging market peers trajectory. The market currently prices in uncertainty regarding how central banks balance sticky inflation against consumer weakening uncertainty. Investors should monitor real disposable income trends for signs of consumer breaking points.
Checklist for Validating Energy-Driven Inflation Shocks
The catalyst is a firm energy print creating a bias to look through noise unless core metrics accelerate. Traders must validate if price pressures are transient or broad-based before assuming a Bank of Canada rate hike. Third, assess whether real disposable income declines force households to draw down savings, a key fragility signal.
| Metric Type | Signal to Ignore | Signal to Hike |
|---|---|---|
| Core Inflation | Stable near target | Broad acceleration |
| Spending Driver | Price-driven only | Volume expansion |
Strategic Implications of Sticky Inflation on Market Positioning
Sticky Inflation Erosion of Real Consumption Power
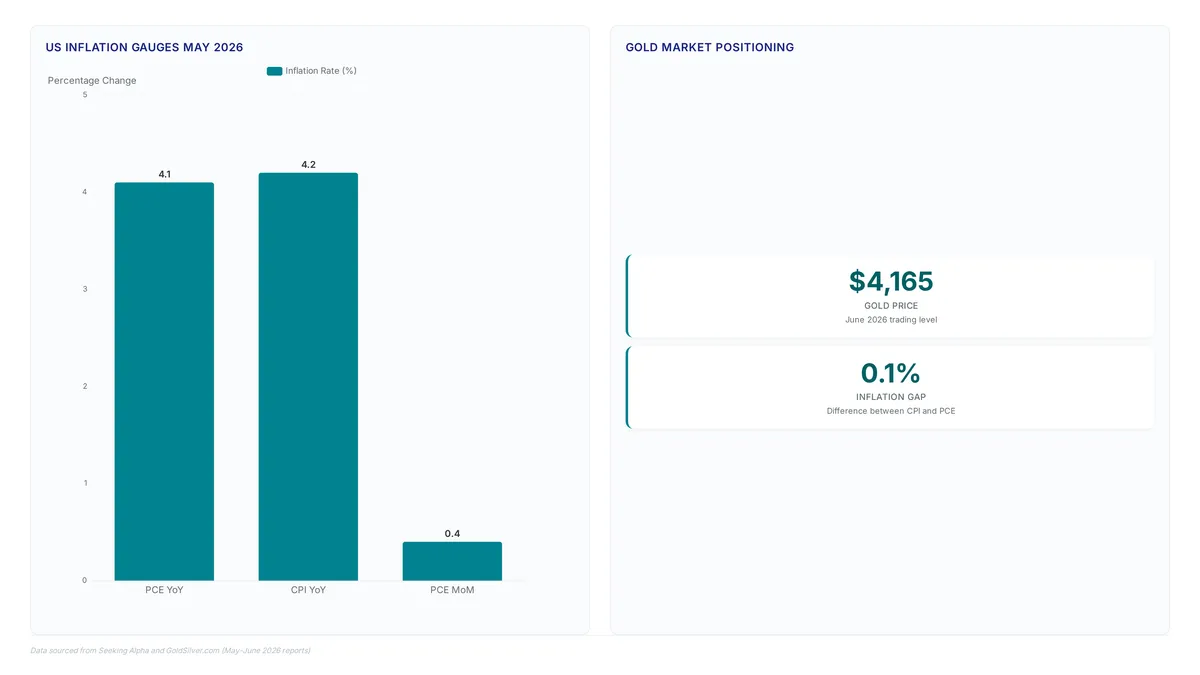
Energy-driven price acceleration acts as the primary catalyst suppressing real consumption volumes. Nominal spending gains vanish when the PCE deflator outpaces income growth, effectively eroding purchasing power. Real disposable income excluding transfer payments has slipped into negative territory on a year-ago basis. Saving rates are bumping up against historic lows. Consumers spend more of their income simply to sustain current activity levels. Larger average tax refunds offset higher gasoline prices in recent months. That tailwind fades as refund flows slow. Gold prices in June 2026 are trading at approximately $4,165 per ounce, a level noted as being 25% below the asset's all-time high, reflecting specific market positioning amid inflation data. Core measures in Canada remain contained. U.S. Underlying fundamentals weaken as the gap between nominal expenditure and actual volume growth widens.
Applying Household Savings Data to Asset Allocation Shifts
Households deplete buffers to sustain consumption when real disposable income turns negative. This signals tangible erosion of the consumer spending pillar. Savings rates now sit near historic lows. The average investor lacks liquidity to absorb further price shocks without reducing asset exposure. Asset allocation models must account for divergence between firm nominal spending and weak real fundamentals. The US Dollar maintained an upward trajectory in June 2026. Commerzbank describes the economy as "steady," a view limiting immediate upside for non-dollar denominated hedges. May 2026 PCE data confirms a trend of sticky inflation. Earlier hopes for rapid cooling of consumer prices face contradiction. Sharp recovery in wage growth is not currently evident. Real income dynamics remain soft. Traders should monitor the June 25 release of PCE data. Subsequent Federal Reserve communications may offer signs of policy shifts influencing this defensive stance.
Risks of Fading Tax Refund Tailwinds on Consumer Durability
Dissipation of seasonal tax refund flows creates headwinds for discretionary spending sustainability. Households previously utilized lump-sum government returns to offset elevated energy costs. This masked erosion of purchasing power. Real disposable income constraints force a direct confrontation with persistent price levels once temporary liquidity vanishes. Nominal spending gains often reflect higher gasoline prices rather than volume growth. Such dynamics become challenging when refund tailwinds vanish. Strategists observe consumer durability is increasingly supported by credit utilization as savings buffers thin. Transition from liquidity spikes driven by refunds to reliance on current income represents a critical inflection point for retail-heavy asset classes. Market participants misinterpreting nominal spending strength as organic demand face significant downside exposure. This lag creates a false sense of security in cyclical equities before the inevitable contraction. Sudden resurgence in real disposable income excluding transfers would invalidate this defensive stance. Current trends suggest further deterioration. Path of least resistance favors protective positioning over aggressive consumption bets.
About
Marcus Halloran, Chief Market Strategist at ForexCFD.top, brings over a decade of interbank FX strategy experience to the analysis of the PCE deflator. Having formerly navigated London dealing desks, Marcus specializes in translating complex monetary data into actionable insights for retail traders. His daily work involves dissecting Federal Reserve signals and inflation metrics like the PCE to forecast USD volatility across G10 majors. This expertise is critical as accelerating inflation directly influences central bank rate decisions, which drive the currency and commodity markets ForexCFD.top covers. As an independent publication, ForexCFD.top uses Marcus's macro framework to provide vendor-neutral analysis on how rising prices impact trading conditions. Rather than promoting third-party tools, the team focuses on delivering clear, regulation-aware education and original market commentary. This approach ensures traders in emerging markets receive factual, risk-aware guidance on navigating high-inflation environments without reliance on external commercial recommendations.
Conclusion
Sticky inflation metrics reveal that nominal spending increases are masking a fracture in organic demand, creating a scenario where asset models relying on headline growth face immediate repricing risks. The divergence between elevated price levels and stagnant real income dynamics means that once seasonal liquidity vanishes, the underlying weakness in consumer durability will likely accelerate. Traders must recognize that current market stability is fragile and dependent on temporary fiscal flows rather than reliable economic fundamentals.
ForexCFD.top advises adopting a defensive posture immediately, specifically conditioning any long exposure on evidence of sustained real wage growth rather than transient nominal spikes. This shift is critical before the next Federal Reserve communication clarifies whether the current policy rate has sufficiently cooled broad-based price pressures without triggering a deeper demand collapse. Investors should prioritize capital preservation over yield chasing until the correlation between spending data and actual household financial health realigns.
Start by auditing your current portfolio's sensitivity to a sharp decline in discretionary retail volumes this week, ensuring your hedges are sized for a potential break in consumer credit utilization. Focus your analysis on how core pce inflation metric trends interact with thinning savings buffers to validate your defensive positioning.
Frequently Asked Questions
Energy costs drive headline gains while real income stays negative. This distortion masks weak fundamentals as savings rates hover near historic lows, forcing traders to ignore nominal strength.
Personal spending may rise at a 0.6% clip in May. However, this increase reflects higher gasoline prices rather than volume growth, indicating consumers are stretching finances to maintain current levels.
Trimmed mean inflation is projected at 2.0% while headline rates exceed 4%. This gap suggests underlying pressure remains contained despite energy spikes, guiding central bank policy decisions effectively.
Real disposable income has slipped into negative territory recently. With savings rates near historic lows, households are increasingly stretched even as nominal consumption tracks a modest pace.
Canadian inflation remains primarily energy-driven with a 0.9% monthly rise. Core measures hold near 2.1%, suggesting the central bank may look through temporary shocks absent broad pass-through.
References