Trend check: GBP/AUD needs hotter inflation data
The RBA sits at 4.35%. Chinese retail sales just dropped 0.6%. Now, GBP/AUD trend continuation hinges entirely on upcoming U. K. Inflation data.
Fundamental catalysts have superseded pure technical patterns. Institutions like ING now leverage AI integration to outprice human judgment in execution. While the pair recently bounced from a key Fibonacci support zone, the multi-trillion dollar daily FX market rewards those aligning mechanical setups with central bank realities, not chart aesthetics.
We need to look at how technical mechanics on the 4-hour chart interact with the Reserve Bank of Australia's stagnant policy. Then, we execute high-probability trades ahead of the Bank of England decision. Hotter-than-expected CPI data could provide the volatility Sterling bulls need to challenge recent highs.
The Role of Trend Continuation and Fundamental Drivers in Forex Markets
Defining Trend Continuation Setups in Forex
A trend continuation setup occurs when price temporarily retraces to a Fibonacci support zone before resuming its primary direction. We saw this when GBP/AUD bounced to extend a month-long uptrend. Market participants treat these pullbacks as buying opportunities, not structural reversals. The global foreign exchange market averages trillions of dollars in daily volume, providing the liquidity necessary for these structures to form without immediate slippage.
Algorithms now detect these retracement zones faster than manual observation allows, distinguishing between a mere pause and genuine trend failure. However, relying solely on automated levels ignores fundamental friction. Geopolitical events, like Middle East conflicts driving energy prices, complicate inflation forecasts.
Central bank divergence creates a hard constraint. If the Bank of England holds rates at 3.75% while inflation persists at 2.8%, the anticipated breakout may lack the required volume. Operators must verify that the ascending channel remains intact against fundamental headwinds before committing capital.
Voting splits create immediate directional bias. When dissent exceeds the 7–2 threshold observed in recent BOE decisions, the market reacts. Participants parse these Monetary Policy Committee votes to gauge future rate paths, especially when two members push for a 4.00% hike against a majority hold. This internal division signals persistent inflationary pressure that standard headlines miss. The resulting volatility forces traders to distinguish between temporary noise and structural shifts in currency valuation. Economic releases drive these reactions by altering probability curves for future policy moves. A chief economist voting against consensus indicates deeper friction, often preceding larger dislocations. Traders must weigh such dissents against conflicting data like falling retail sales.
Automated systems like DeepFX attempt to forecast five-minute price movements using deep learning. Human interpretation of underlying political tension remains superior during initial releases. Algorithms react to the number; humans price the narrative shift. Successful application requires correlating the hawkish tone of governors with hard data points rather than relying on single metrics.
Risks of Ignoring Dissenting Votes and Trade Data
Blind spots emerge when traders ignore dissenting votes while inflationary pressures drive wedge formation. Sharp volatility spikes often follow this internal division, escaping capture by technical retracement levels.
External data compounds this risk. Chinese retail sales contracting by 0.6% directly corrodes Australian export demand, yet traders often miss this correlation during high-frequency sessions. Retail derivatives traders in India reportedly lost 1.8 trillion rupees over three years, a statistic reflecting the severe cost of neglecting such fundamental divergences.
Pure technical analysis fails when fundamental drivers diverge from chart patterns. Relying solely on Fibonacci zones without monitoring global commodity prices exposes positions to sudden reversals. Geopolitical conflict frequently inflates energy costs, altering inflation trajectories unexpectedly. Traders must integrate central bank minutes with trade data to validate trend continuation setups. Failure to cross-reference these distinct data streams leaves portfolios vulnerable to asymmetric shocks. The market rewards those who parse the nuance in voting records rather than just the headline rate decision. Ignoring these signals invites unnecessary drawdown during otherwise predictable trend phases. Proper risk management demands this dual-layer verification before entry.
Technical Mechanics of Fibonacci Retracements and Pivot Points on the 4-Hour Chart
Defining the Golden Zone and Pivot Point Thresholds
Price action frequently stabilizes inside the Golden Zone, a region spanning the 38.2% to 50% Fibonacci retracement levels during trend continuations. These ratios derive from dividing the vertical distance between swing extremes by specific mathematical constants found in Fibonacci Calculation Architecture. Algorithms target liquidity pools residing just beyond standard shallow retracements, causing market participants to monitor this range closely.
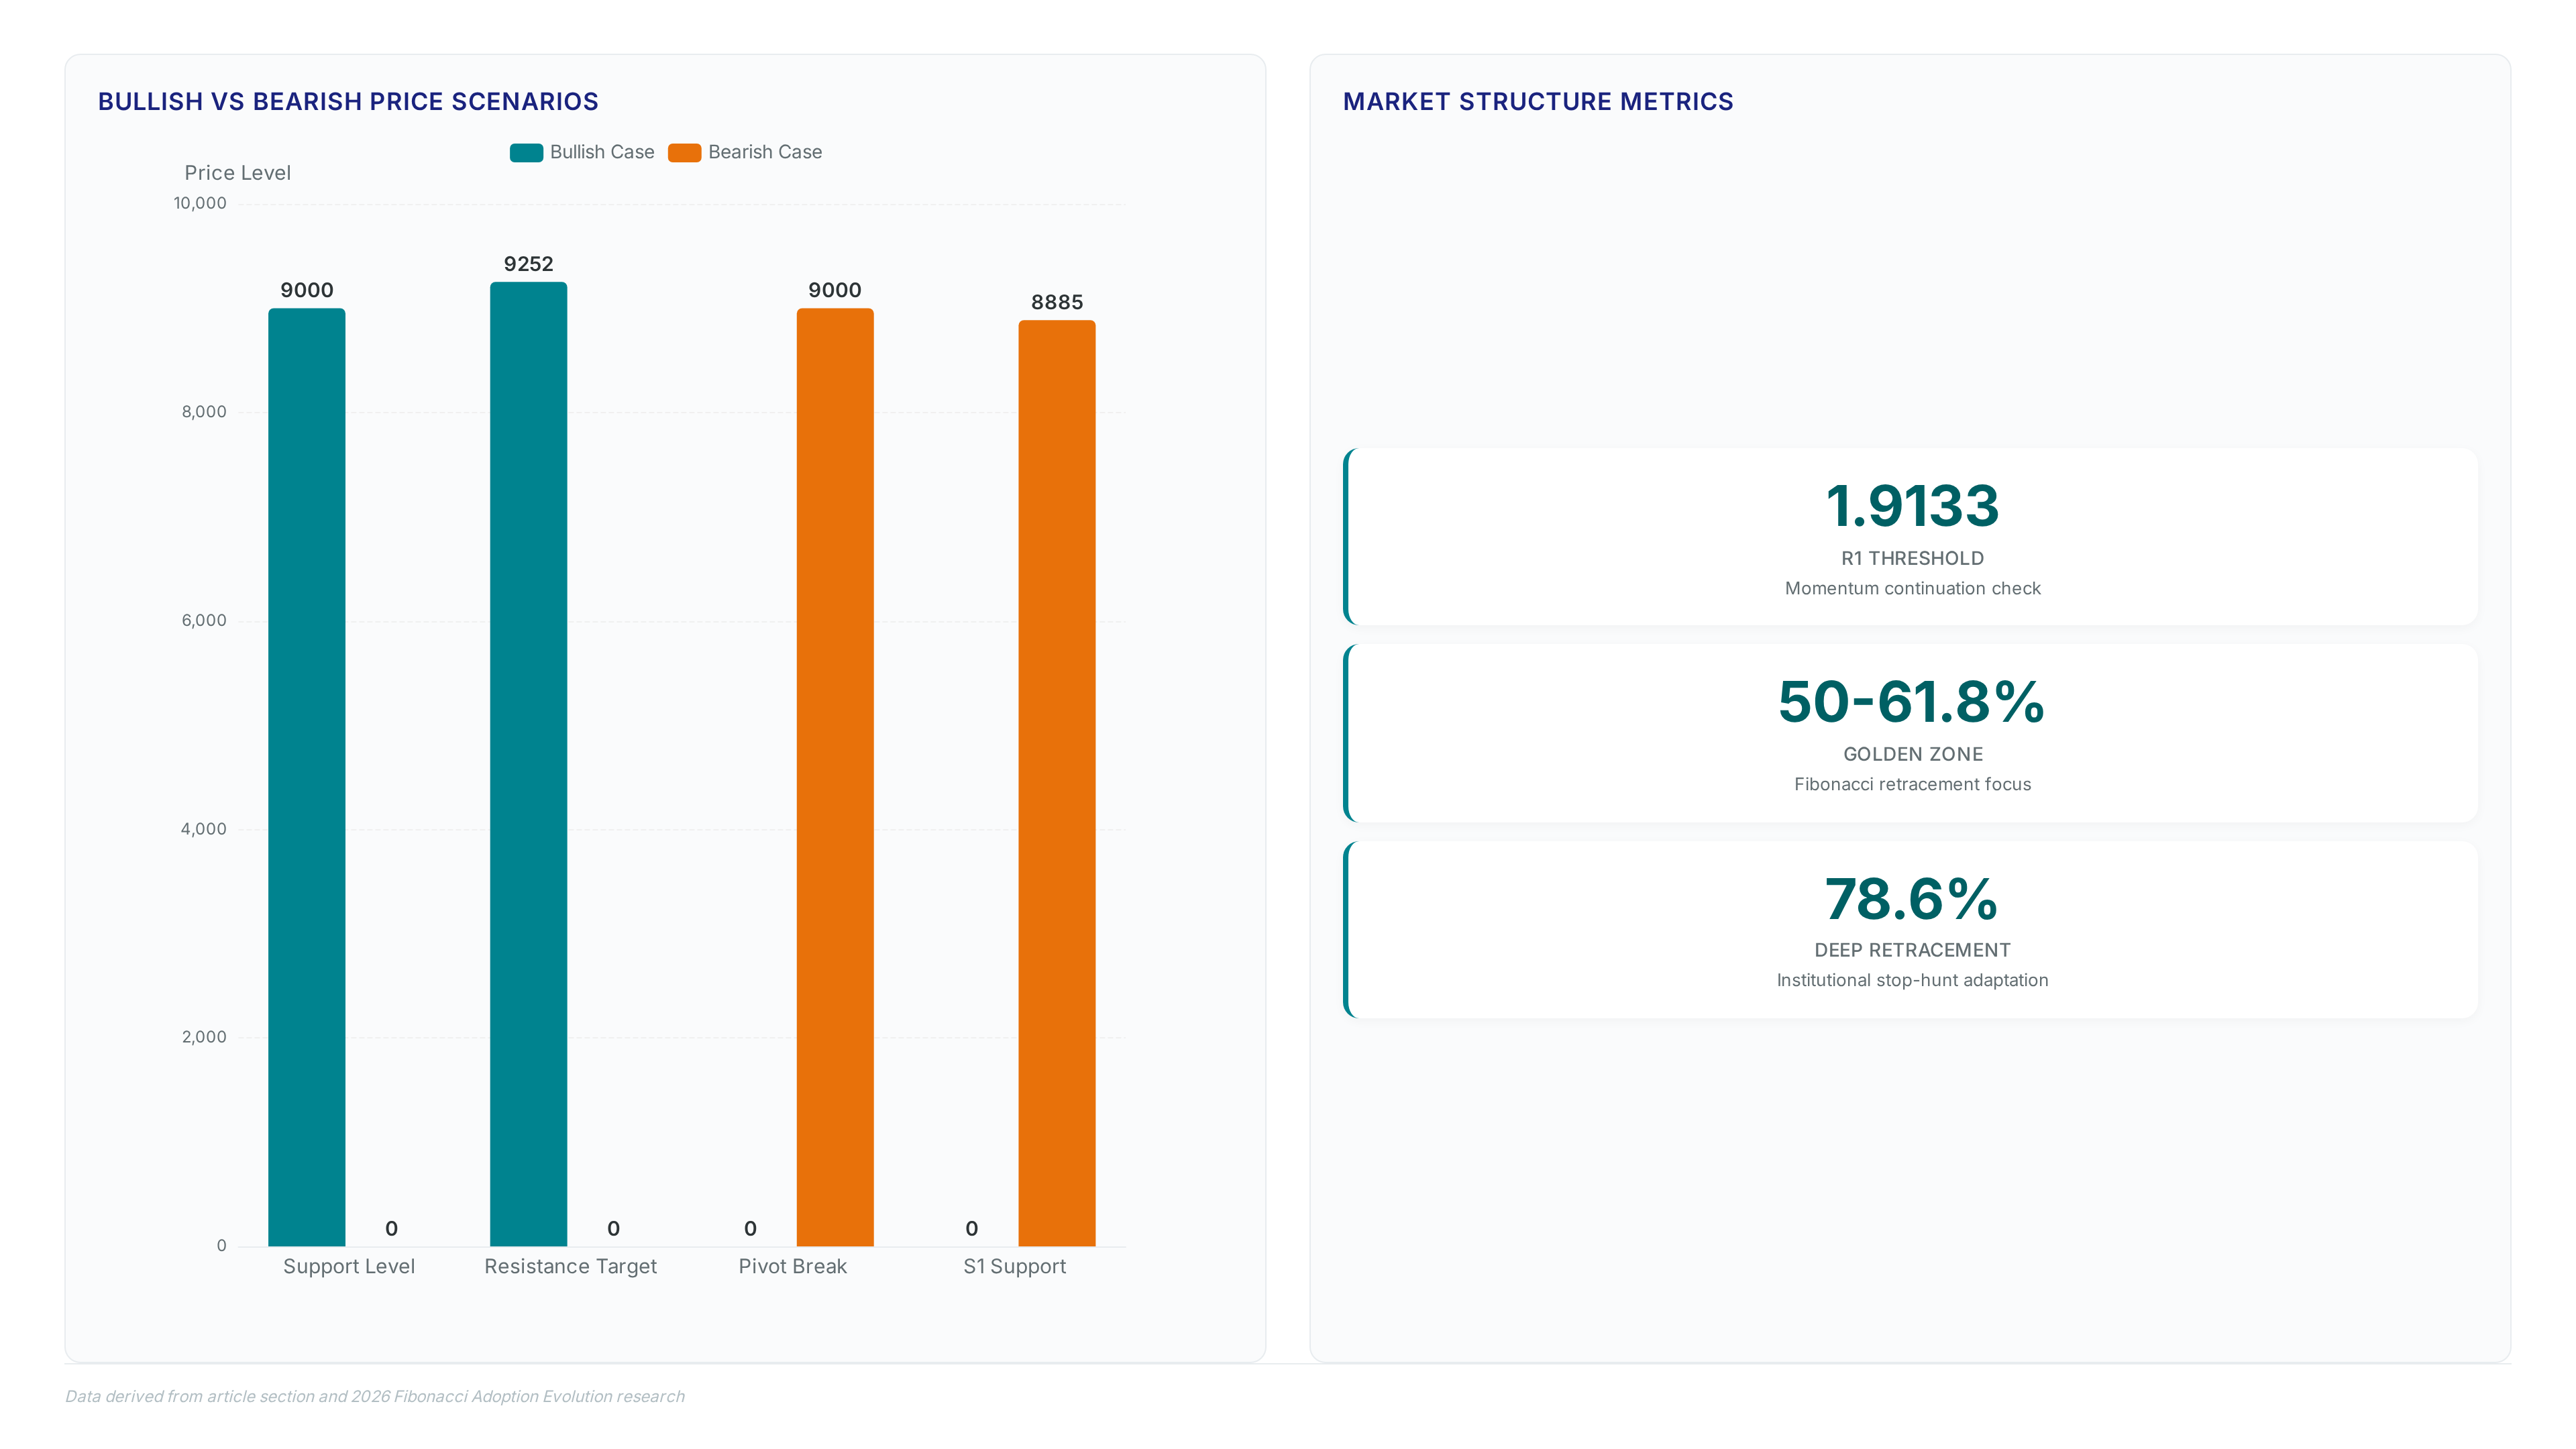
Professional traders in 2026 are increasingly focusing on deeper retracements up to the 78.6% level to avoid institutional stop-hunts, adapting entry strategies accordingly (Fibonacci Adoption Evolution 5dollarsimpact.com/2026/01/mastering-fibonacci-retracement-forex. Html). Static reference frames from Pivot Point thresholds validate these flexible fib zones. R1 resistance and S1 support values calculate from the previous session's high, low, and close data.
A confluence occurs when a Pivot Point aligns with a Fibonacci level, creating a high-probability reversal node. Equities research identifies the 61.8% ratio as the most critical level for high-probability entries, often acting as the final defense before a trend invalidates. This distinction prevents premature entries during volatile central bank announcements.
Plotting Ascending Channels and Entry Triggers on GBP/AUD
Holding above the Pivot Point at 1.904 while respecting the 1.9000 handle as a hard floor validates an ascending channel. Traders define the initial channel boundaries by anchoring the Fibonacci retracement tool from the recent swing low to the 1.9133 high. A confirmed entry trigger occurs only when price action prints a bullish reversal candle after touching these lines.
Modern technical architectures now integrate Smart Money Concepts. Relying solely on static lines without confirming a Change of Character exposes capital to false breakouts. The limitation is a higher frequency of stopped-out trades during low-volume sessions. This discipline separates mechanical gambling from strategic execution in liquid forex pairs.
Executing High-Probability Trades Ahead of the Bank of England Decision
Defining Bullish and Bearish Scenarios for GBP/AUD

Validating the Bullish Case requires price to hold above the 1.9000 handle while targeting R1 at 1.9133. Momentum must sustain through the 1.904 Pivot Point to avoid a false breakout. Historical volatility patterns in assets like Tesla demonstrate how price respects specific retracement floors before extending trends. A clean break above resistance opens the path toward R2 at 1.9252 within the ascending channel structure. This scenario assumes U. K. Data supports Sterling strength despite global headwinds.
The Bearish Case triggers if price slips below the psychological 1.9000 level and the daily Pivot. Attention immediately shifts to S1 at 1.8885 as sellers dominate the session.
A limit order at 1.9000 may fill, but a stop-loss below that level often executes at the next available price, compounding the drawdown. This structural asymmetry means a trader can be correct on direction yet still lose capital due to execution quality. Strict position sizing becomes the only defense against these hidden fees eating into the margin. Ignoring these friction costs turns a statistically sound technical setup into a net-negative expectation game. Proper risk management requires calculating the break-even point including the worst-case spread scenario, not the mid-price.
Distinguishing Valid Retracements from False Breakouts and Reversals
Defining Retracement Versus Reversal Characteristics
Price holding above prior swing lows signals a retracement, while a decisive break prints a Change of Character. Algorithms integrating Smart Money Concepts filter market noise by hunting for a Break of Structure to confirm trend health before triggering signals. This Smart Money Integration Static tools often miss the flexible confluence scoring found in advanced enterprise implementations. Liquidity sweeps frequently target retail stops below obvious support, causing static levels to fail.
Operators must tell the difference between a temporary liquidity grab and actual structural failure. Coverage Pillars subscribers access full lessons on applying these distinctions to live charts. Misidentifying a reversal as a retracement leads to holding losing positions against a trend change. Correctly identifying the Change of Character prevents capital depletion during substantial trend shifts.
Applying Fibonacci Levels to GBP/AUD Scenarios
Mapping price paths against the 1.9133 R1 threshold clarifies whether current momentum represents trend continuation or a false breakout. Accurate diagnosis requires observing if the market respects Fibonacci Structure Engine. A genuine Bullish Case holds the 1.9000 handle while targeting the 1.9252 resistance level within the ascending channel. Conversely, a confirmed Bearish Case breaks the Pivot Point and accelerates toward S1 support at 1.8885. Algorithms now automate Smart Money Concepts. Distinguishing between a structural break and a volatility spike avoids premature exits. Coverage Pillars subscribers can access full School of Pipsology modules to refine these diagnostic criteria across varying market conditions.
Comparing Healthy Bounces Against False Breakouts
Valid trend continuation requires price to close above the 1.9000 handle with expanding volume, whereas false breakouts reverse immediately after tagging resistance. Modern automation of technical analysis Algorithms validate the Bullish Case only when price clears 1.9133 without immediate rejection, confirming momentum rather than exhaustion. A move below the pivot suggests a shift toward the Bearish Case where deeper fills at 1.8885 become probable. Traders accessing School of Pipsology lessons note that distinguishing these patterns prevents entering during low-probability traps. The cost of misidentification is a rapid stop-out as price seeks the S2 level near 1.8755. Market participants must wait for candle closes rather than reacting to intra-bar spikes. This discipline filters noise from genuine directional bias ahead of central bank decisions.
About
Sofia Mendes, Broker Reviews & Trading Education Editor at ForexCFD. Top, brings a disciplined, risk-first perspective to the analysis of the GBP/AUD currency pair. While her daily work focuses on vetting regulated brokers and teaching sound money management, these fundamentals are critical when navigating volatile substantial crosses ahead of high-stakes events like the Bank of England decision. Her expertise in evaluating execution quality and spread stability directly informs her view on whether current technical setups, such as Fibonacci bounces, offer viable continuation plays for retail traders. At ForexCFD. Top, an independent publication dedicated to vendor-neutral market news and education, Sofia ensures that complex macro drivers, including RBA rate decisions, are contextualized through a lens of practical trading safety. This approach connects deep market mechanics with the educational rigor necessary for traders to understand not just where price might go, but how to manage the inherent risks of forex trading effectively.
Conclusion
Liquidity fragmentation becomes the primary failure point when cross-border capital flows shift abruptly due to divergent monetary policy expectations. While technical levels like the 1.9000 handle offer clear binary outcomes, the real risk lies in the widening spread between bid and ask prices during low-volume sessions, specifically when Chinese economic data releases trigger algorithmic liquidations. Traders often underestimate the compounding cost of slippage during these volatility spikes, which erodes profitability quicker than minor misreads of Fibonacci retracements. The market does not reward passive observation of support zones; it penalizes hesitation when structural breaks occur without corresponding volume confirmation.
Transition from reactive pattern recognition to proactive liquidity mapping immediately. Do not wait for the next Bank of England decision to test your execution strategy. Begin by auditing your current stop-loss placement logic against historical volatility clusters from the last quarter, ensuring stops sit outside typical noise ranges rather than arbitrary round numbers. Complete this audit within the next five trading days to align your risk parameters with current market microstructure realities. This specific adjustment protects capital more effectively than predicting the next directional move, allowing you to survive the inevitable false breakouts that trap undisciplined participants.
Frequently Asked Questions
The global foreign exchange market provides massive liquidity for trading pairs. This market averages $9.6 trillion in daily volume, ensuring sufficient depth for executing large orders without significant slippage issues.
Weak Chinese demand directly corrodes Australian export prospects significantly. Specifically, Chinese retail sales contracting by 0.6% creates a negative fundamental headwind that limits the Australian dollar's upward potential.
A hold at current rates while inflation persists may lack required volume. If the Bank of England holds rates at 3.75% while inflation persists at 2.8%, the anticipated breakout may lack the necessary momentum.
The Golden Zone spans specific retracement levels where price often reacts. This zone spans the 38.2% to 50% Fibonacci retracement levels, acting as a critical area for potential trend continuation setups.
The 61.8% ratio remains the most critical level for identifying high-probability reversal nodes. Traders watch this deep retracement closely to distinguish valid support from false breakouts during volatile sessions.